Breaking News
Showing posts with label wind. Show all posts

Wednesday, 8 February 2017

Warning of mass extinction of species, including humans, within one decade


[ click on images to enlarge ]
On February 10, 2017, 18:00 UTC it is forecast to be 0.1°C or 32.1°F at the North Pole, i.e. above the temperature at which water freezes. The temperature at the North Pole is forecast to be 30°C or 54°F warmer than 1979-2000, on Feb 10, 2017, 18:00 UTC, as shown on the Climate Reanalyzer image on the right.

This high temperature is expected as a result of strong winds blowing warm air from the North Atlantic into the Arctic.

The forecast below, run on February 4, 2017, shows that winds as fast as 157 km/h or 98 mph were expected to hit the North Atlantic on February 6, 2017, 06:00 UTC, producing waves as high as 16.34 m or 53.6 ft.


A later forecast shows waves as high as 17.18 m or 54.6 ft, as illustrated by the image below.


While the actual wave height and wind speed may not turn out to be as extreme as such forecasts, the images do illustrate the horrific amounts of energy contained in these storms.

Stronger storms go hand in hand with warmer oceans. The image below shows that on February 4, 2017, at a spot off the coast of Japan marked by green circle, the ocean was 19.1°C or 34.4°F warmer than 1981-2011.


As discussed in an earlier post, the decreasing difference in temperature between the Equator and the North Pole causes changes to the jet stream, in turn causing warmer air and warmer water to get pushed from the North Atlantic into the Arctic.

The image below shows that on February 9, 2017, the water at a spot near Svalbard (marked by the green circle) was 13°C or 55.3°F, i.e. 12.1°C or 21.7°F warmer than 1981-2011.

[ click on images to enlarge ]
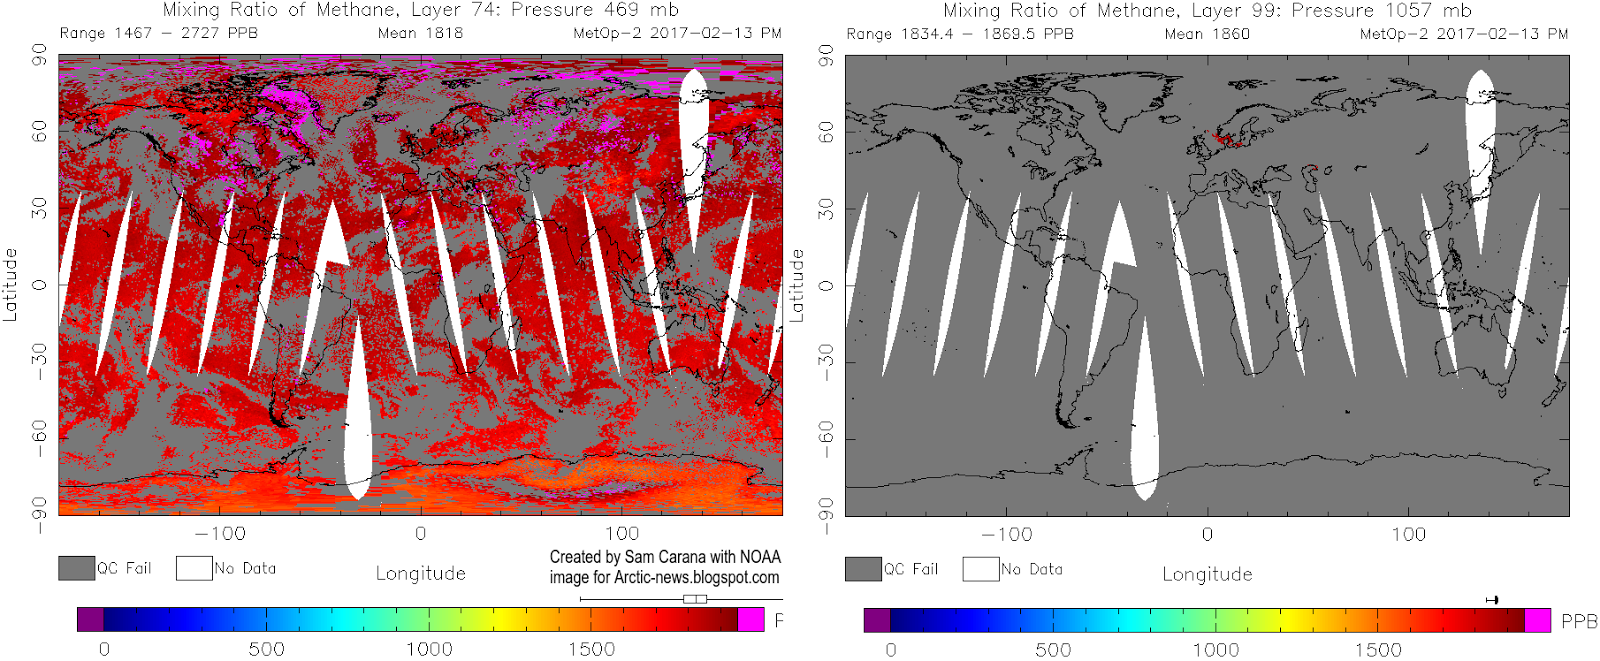
Warmer water flowing into the Arctic Ocean in turn increases the strength of feedbacks that are accelerating warming in the Arctic. One of these feedbacks is methane that is getting released from the seafloor of the Arctic Ocean. Update: The image below shows that methane levels on February 13, 2017, pm, were as high as 2727 ppb, 1½ times the global mean at the time.

[ click on image to enlarge, right image added for reference to show location of continents ] 
What caused such a high level? High methane levels (magenta color) over Baffin Bay are an indication of a lot of methane getting released north of Greenland and subsequently getting pushed along the exit current through Nares Strait (see map below). This analysis is supported by the images below, showing high methane levels north of Greenland on the morning of February the 14th (left) and the 15th (right).


The image below shows methane levels as high as 2569 ppb on February 17, 2017. This is an indication of ocean heat further destabilizing permafrost at the seafloor of the Laptev Sea, resulting in high methane concentrations where it is rising in plumes over the Laptev Sea (at 87 mb, left panel) and is spreading over a larger area (at slightly lower concentrations) at higher altitude (74 mb, right panel).


This illustrates how increased inflow of warm water from the North Atlantic into the Arctic Ocean can cause methane to erupt from the seafloor of the Arctic Ocean. Methane releases from the seafloor of the Arctic Ocean have the potential to rapidly and strongly accelerate warming in the Arctic and speed up further feedbacks, raising global temperature with catastrophic consequences in a matter of years. Altogether, these feedbacks and further warming elements could trigger a huge abrupt rise in global temperature making that extinction of many species, including humans, could be less than one decade away.


Without action, we are facing extinction at unprecedented scale. In many respects, we are already in the sixth mass extinction of Earth’s history. Up to 96% of all marine species and 70% of terrestrial vertebrate species became extinct when temperatures rose by 8°C (14°F) during the Permian-Triassic extinction, or the Great Dying, 252 million years ago.

During the Palaeocene–Eocene Thermal Maximum (PETM), which occurred 55 million years ago, global temperatures rose as rapidly as by 5°C in ~13 years, according to a study by Wright et al. A recent study by researchers led by Zebee concludes that the present anthropogenic carbon release rate is unprecedented during the past 66 million years. Back in history, the highest carbon release rates of the past 66 million years occurred during the PETM. Yet, the maximum sustained PETM carbon release rate was less than 1.1 Pg C per year, the study by Zebee et al. found. By contrast, a recent annual carbon release rate from anthropogenic sources was ~10 Pg C (2014). The study by Zebee et al. therefore concludes that future ecosystem disruptions are likely to exceed the - by comparison - relatively limited extinctions observed at the PETM.

An earlier study by researchers led by De Vos had already concluded that current extinction rates are 1,000 times higher than natural background rates of extinction and future rates are likely to be 10,000 times higher.

from the post 2016 well above 1.5°C
As above image shows, a number of warming elements adds up to a potential warming of 10°C (18°F) from pre-industrial by the year 2026, i.e. within about nine years from now, as discussed in more detail at the extinction page.


Above image shows how a 10°C (18°F) temperature rise from preindustrial could be completed within a decade.

https://sites.google.com/site/samcarana/climateplan
The situation is dire and calls for comprehensive and effective action, as discussed in the Climate Plan.


Links

• Climate Plan
http://arctic-news.blogspot.com/p/climateplan.html

• Arctic Ocean Feedbacks
http://arctic-news.blogspot.com/2017/01/arctic-ocean-feedbacks.html

• Extinction
http://arctic-news.blogspot.com/p/extinction.html

• How much warming have humans caused?
http://arctic-news.blogspot.com/2016/05/how-much-warming-have-humans-caused.html

• Estimating the normal background rate of species extinction, De Vos et al. (2015)
https://www.ncbi.nlm.nih.gov/pubmed/25159086

• Anthropogenic carbon release rate unprecedented during the past 66 million years, by Zebee et al. (2016)
http://www.nature.com/ngeo/journal/v9/n4/full/ngeo2681.html

• Evidence for a rapid release of carbon at the Paleocene-Eocene thermal maximum, Wright et al. (2013)
http://www.pnas.org/content/110/40/15908.full?sid=58b79a3f-8a05-485b-8051-481809c87076

• RT America Youtube video
https://www.youtube.com/watch?v=OSnrDRU6_2g

• RT America Facebook video
https://www.facebook.com/RTAmerica/videos/10154168391051366


Warning of mass extinction of species, including humans, within one decade. The forecast for February 10, 2017, 18:00 UTC is that it will be 32.1°F or 0.1°C on North Pole, i.e. above freezing…
Posted by Sam Carana on Wednesday, February 8, 2017
Read more ...

Friday, 19 August 2016

Storms over Arctic Ocean


Winds over the Arctic Ocean reached speeds of up to 32 mph or 52 km/h on August 19, 2016. The image below shows the Jet Stream crossing Arctic Ocean on August 19, 2016 (see map on above image for geographic reference).


The Naval Research Lab image on the right shows a forecast for sea ice speed and drift run on August 15, 2016, and valid for August 17, 2016.

These storms come at a time when the sea ice has become extremely thin, as illustrated by the Naval Research Lab sea ice thickness animation below, covering a 30-day period run on August 17, 2016, with a forecast through to August 25, 2016. The animation shows that the multi-year sea ice has now virtually disappeared.

With the sea ice in such a bad shape, strong winds can cause a rapid drop in sea ice extent, at a time when the Arctic still has quite a bit of insolation. At the North Pole, insolation will come down to zero at the time of the September 2016 Equinox.


Even more terrifying is the Naval Research Lab’s Arctic sea ice thickness forecast for August 25, 2016, run on August 17, 2016, using a new Hycom model, as shown on the right.

With the thicker multi-year sea ice now virtually gone, the remaining sea ice is prone to fracture and to become slushy, which also makes it darker in color and thus prone to absorb more sunlight.

Furthermore, if strong winds keep hitting the Arctic Ocean over the next few weeks, this could push much of the sea ice out of the Arctic Ocean, along the edges of Greenland and into the Atlantic Ocean.
Strong winds are forecast to keep hitting the Arctic Ocean hard for the next week, as illustrated by the image on the right showing a forecast for August 24, 2016.

As sea ice extent falls, less sunlight gets reflected back into space and is instead absorbed by the Arctic. Once the sea ice is gone, this can contribute to a rapid rise in temperature of the surface waters.

The video below shows cci-reanalyzer.org wind speed at 10 meters forecasts from August 25, 2016 1800 UTC to September 2, 2016 0300 UTC.


The left panel on the image below shows winds (surface) reaching speeds as high as 61 km/h or 38 mph over the Arctic Ocean (green circle), while the right panel shows winds at 250 hPa (jet stream).


As the Arctic warms faster than the rest of the world, the temperature difference between the Equator and the Arctic decreases, slowing down the speed at which the Northern Polar Jet Stream circumnavigates Earth, and making it wavier.

As a result, the Jet Stream can extend far over North America and Eurasia, enabling cold air to move more easily out of the Arctic (e.g. deep into Siberia) and at the same time enabling warm air to move more easily into the Arctic (e.g. from the Pacific Ocean). Such changes to the jet stream also enable strong winds to cross East Siberia more easily and cause stormy weather over the Arctic Ocean.

This is illustrated by the image below. The left panel shows the jet stream crossing East Siberia at speeds as high as 277 km/h or 172 mph on August 27, 2016, while at surface level cyclonic winds occurring over the Arctic ocean reached speeds as high as 78 km/h or 48 mph that day.

The right panel shows that, on that day, cold air moved deep into Central Siberia, resulting in temperatures as lows as -15.9°C or 3.5°F in Central Siberia and temperatures that were higher than they used to be over the Arctic Ocean.


[ click on image to enlarge ]
The image on the right shows surface winds (top) and winds at 250 hPa (i.e. jet stream, bottom) over the Arctic Ocean causing snow (blue) and rain (green) to fall north of Greenland (center).

Rain can have a devastating impact on the sea ice, due to kinetic energy breaking up the ice as it gets hit.

This can fragment the ice, resulting in water that is warmer than the ice to melt it both at the top and at the sides, in addition to melting that occurs at the bottom due to ocean heat warming the ice from below and melting that occurs at the top due to sunlight warming the ice from above.

Furthermore, where the rainwater stays on top of the sea ice, pools of water will form, fed by rainwater and meltwater. This will darken the surface. Melting sea ice is also darker in color and, where sea ice melts away altogether, even darker water will emerge. As a result, less sunlight is getting reflected back into space and more sunlight is instead absorbed.

The image below shows Arctic sea ice thickness (in m, nowcast, run on August 27, 2016, valid for August 28, 2016, panel left) and Arctic sea ice speed and drift (in cm per second, nowcast, run on August 27, 2016, valid for August 28, 2016, panel right).


The danger is that such storms, especially at this time of year, can push much sea ice out of the Arctic Ocean, along the edges of Greenland, into the Atlantic Ocean.


This danger grows as the sea ice gets thinner. Above image shows ice thickness (in m) nowcasts, run on August 30 and valid for August 31, for each year from 2012 to 2016.


Next to loss of snow and ice cover, another big danger in the Arctic is methane releases.

Above image shows methane levels as high as 2454 ppb on August 25, 2016 (top panel), strong releases from Alaska to Greenland on August 26, 2016 (middle panel), and mean methane levels as high as 1862 ppb on August 27, 2016 (bottom panel).

The image on the right shows high methane levels recorded at Barrow, Alaska, up to August 30, 2016.

The image below shows cyclonic winds (center left) over the Arctic Ocean on August 22, 2016.


The image below shows how little sea ice was left at locations close to the North Pole on August 25, 2016.


[ click on images to enlarge ]
The image on the right shows that Arctic sea ice extent was 4.8 million square km on August 27, 2016, according to the NSIDC.

NOAA data show that the July 2016 global land and ocean temperature was 16.67°C or 62.01°F, the highest temperature for any month on record.

The image below on the right shows July sea surface temperature anomalies (compared to the 20th century average) on the Northern Hemisphere.

This ocean heat is now being carried by the Gulf Stream toward to Arctic Ocean.

Meanwhile, the cold sea surface area that was so pronounced over the North Atlantic in 2015, is getting overwhelmed by ocean heat.

This is illustrated by the image below showing sea surface temperature anomalies on August 27, 2015 (left panel) and on August 27, 2016 (right panel).


The image below shows sea surface temperature anomalies in the Arctic (latitude 60°N-90°N) compared to 1961-1990.


The Climate Reanalyzer image below also shows sea surface temperature anomalies August 16, 2016, this time compared to 1979-2000.


The image below, from an earlier post, shows sea surface temperature anomalies on August 12, 2016, in the left-hand panel, and sea surface temperature anomalies in the right-hand panel.

Sea surface temperature and anomaly. Anomalies from +1 to +2 degrees C are red, above that they turn yellow and white
Above image also shows that on August 12, 2016, sea surface temperatures near Svalbard (at the location marked by the green circle) were as high as 18.9°C or 65.9°F, an anomaly of 13.6°C or 24.4°F.

As said above, changes to the Jet Stream enable warm air to move more easily into the Arctic Ocean and cold air to move more easily out of the Arctic Ocean. Where seas are shallow, a surface temperature rise can quickly warm up water all the way down to the Arctic ocean seafloor, where it can destabilize methane hydrates contained in sediments.

This could make that huge amounts of methane get released from the seafloor. Given that many of the seas in Arctic are very shallow, much of this methane can enter the atmosphere without getting broken down in the water, resulting in huge additional warming, especially over the Arctic. As discussed in an earlier post, this could contribute to a global temperature rise of over 10°C or 18°F by the year 2026.

One of the people who has been warning about these dangers for many years is Professor Peter Wadhams, whose new book A Farewell to Ice was recently launched (256 pages, published September 1, 2016).

The situation is dire and calls for comprehensive and effective action, as discussed at the Climate Plan.


Links

 Wildfires in Russia’s Far East
http://arctic-news.blogspot.com/2016/08/wildfires-in-russias-far-east.html

 Climate Plan
http://arctic-news.blogspot.com/p/climateplan.html

 Rain Storms Devastate Arctic Ice And Glaciers 
Read more ...

Thursday, 1 October 2015

Cyclones continue to hit Northern Hemisphere

As the 2015 El Niño gets stronger, the Northern Hemisphere continues to get hit by strong winds and cyclones. The image below shows strong winds over the Arctic Ocean, as hurricane Joaquin approaches the coast of North America.


On above image, hurricane Joaquin is clocked at a speed of 79 mph (127 km/h) on October 1, 2015. NOAA warned that on that day the maximum sustained wind speed had increased to near 120 mph (195 km/h) with higher gusts.

For reference, NOAA uses four categories:
D: Tropical Depression – wind speed less than 39 mph (63 km/h)
S: Tropical Storm – wind speed between 39 mph and 73 mph (63 km/h - 118 km/h)
H: Hurricane – wind speed between 74 mph and 110 mph (118 km/h - 177 km/h)
M: Major Hurricane – wind speed greater than 110 mph (over 177 km/h)

NOAA issued the image below on September 30, 2015, warning that Hurricane Joaquin is likely to cause wind damage across a large part of the eastern coast of North America.


The NOAA animation below gives an idea of the strength of hurricane Joaquin.

[ click on image to enlarge, note that this is a 1.4 MB file that may take some time to fully load ]

Meanwhile, sea surface temperatures off the North American coast, as well as in the Arctic Ocean, are very high, as illustrated with the image on the right.

In the Arctic Ocean, the sea ice in many places is now less thick than it was in 2012, as illustrated by the image further below, showing sea ice thickness on October 7, 2012 (panel left) and a forecast for October 7, 2015 (panel right).

The water in the Arctic Ocean was already very warm this year. The main factor causing both these strong winds and the dramatic decrease in thickness of the multi-year sea ice is ocean heat, as also illustrated by the image below, showing high sea surface temperature anomalies in the Arctic as at September 30, 2015.


As the image below shows, nearly all the thick (over 3 m) multi-year sea ice has now disappeared, setting up a dangerous situation for the future that is much more dangerous than the situation was back in 2012. The thicker sea ice used to act as a buffer, consuming ocean heat in the melting process. Without thicker sea ice, ocean heat threatens to melt the sea ice from below right up to the surface, causing the entire sea ice to collapse as more open water will go hand in hand with stronger winds and waves. In case of such a collapse, sunlight that was previously reflected back into space will instead be absorbed by the water, causing rapid rise of the temperature of the water. In places such as the East Siberian Arctic Shelf, the water is on a average only 50 m deep, so warmer water is able to reach the seafloor more easily there.


The water of the Arctic Ocean is very warm, not only at the surface, but even more so underneath the surface. The danger is that strong winds will mix warm water all the way down to the seafloor, where it could destabilize sediments that can contain huge amounts of methane in the form of hydrates and free gas.

[ click on image to enlarge ]
The image on the right illustrates the impact of winds over the East Siberian Arctic Shelf on September 26, 2015.

NSIDC specialist Julienne Stroeve recently warned“In 2007 more than 3m of bottom melt was recorded by [an] ice mass balance buoy in the region, which was primarily attributed to earlier development of open water that allowed for warming of the ocean mixed layer. But perhaps some of this is also a result of ocean mixing.”

As discussed in an earlier post, sea surface anomalies of over 5°C were recorded in August 2007 in the Arctic Ocean. Strong polynya activity caused more summertime open water in the Laptev Sea, in turn causing more vertical mixing of the water column during storms in late 2007 and bottom water temperatures on the mid-shelf increased by more than 3 degrees Celsius compared to the long-term mean.

The situation is dire and calls for comprehensive and effective action, as discussed at the Climate Plan.


As the 2015 El Niño gets stronger, the Northern Hemisphere continues to get hit by strong winds and cyclones. The image…
Posted by Sam Carana on Thursday, October 1, 2015
Read more ...

Friday, 24 July 2015

Thick Sea Ice Dislodged

As the comparison image below shows, the last bit of thick sea ice has become dislodged from its location in the Canadian Archipelago and is forecast to be floating along with the sea ice in the Arctic Ocean. The left panel shows the situation on July 19, 2015, while the right panel shows a forecast for July 31, 2015, run on July 23, 2015.


One reason for this development is of course the heavy melting that has taken place in this area. But what has made this thick sea ice move so strongly? The reason for this is a combination of wind, sea currents and meltwater running off the coasts of North America and Greenland. This has been persistently pushing this thick ice in this direction, as illustrated by the Naval Research Laboratory animation below.


The Naval Research Laboratory animation below shows sea ice thickness over a 30-day timespan, including a forecast up to 31 July, 2015, run July 23, 2015.


The screenshot below from arctic-io shows the sea ice on July 23, 2015, with an inset showing a rotated outcut from a Naval Research Laboratory ice thickness map for that date.
[ click on image to enlarge ]
The animation below shows a 5-day forecast of ice speed and drift up to July 27, 2015, starting from and run on July 23, 2015.


Furthermore, there has been a lot of smoke from wildfires in North America for some time. The image below shows smoke reaching far into the Beaufort Sea on July 22, 2015.


When smoke settles on snow and ice, it decreases albedo and makes it more prone to melting.

Seismic activity could also have contributed to this development. As the snow and ice cover on land disappears, isostatic rebound occurs, i.e. the land moves upward. Furthermore, an earthquake with a magnitude of 3.6 on the Richter scale was registered in Baffin Bay on July 22, 2015.


Above animation shows the last bit of thick sea ice becoming dislodged from its location in the Canadian Archipelago, from July 21, 2015, through to July 24, 2015.


Albert Kallio comments: "The more ice moves, the more heat it can pick up from the ocean - and melt. Also, the overturning of sea water in the ocean increases in the increasingly open sea areas - bringing heat up to the surface - and into contact with ice that then melts faster.“

[ hat tip to Patrick McNulty for contributions to this post ] 


The last bit of thick sea ice has become dislodged from its location in the Canadian Archipelago and is forecast to be…
Posted by Sam Carana on Friday, July 24, 2015
Read more ...
Designed By Published.. Blogger Templates