Breaking News
Showing posts with label threat. Show all posts

Monday, 3 August 2015

Arctic Sea Ice Collapse Threatens - Update 3

The image below is based on a nullschool.net forecast for August 6, 2015, run on August 2, 2015. It shows temperatures as high as 26.4°C (or 79.4°F) in the north of Canada (green circle). The inset, based on a Climate Reanalyzer forecast for that date, shows that this is as much as 20°C (or 36°F) higher than temperatures that were common in the area only recently, i.e. from 1979-2000.


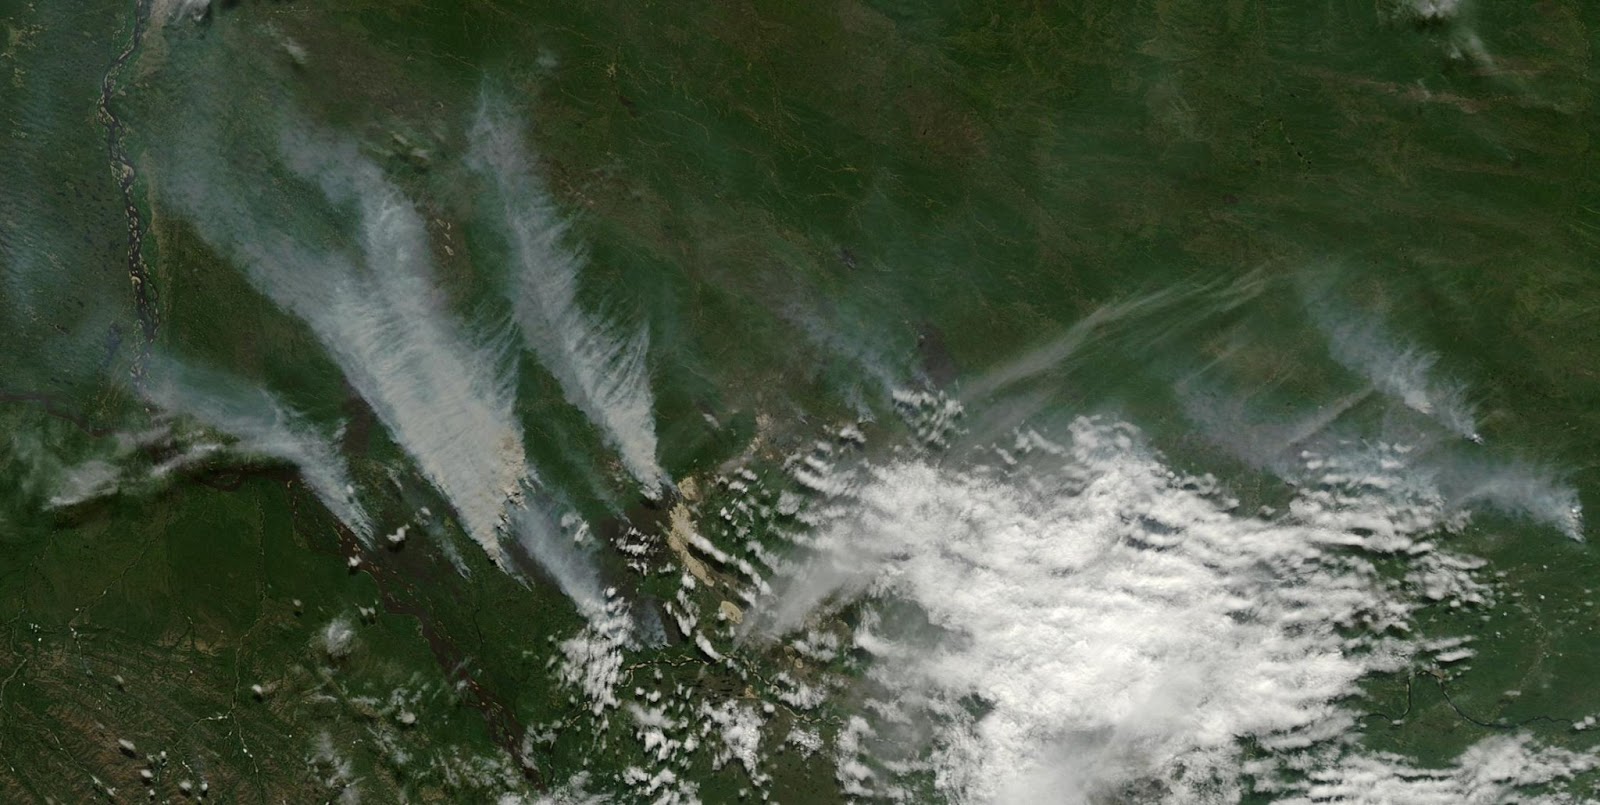
The satellite image below, captured on August 2, 2015, shows a close-up of the area, with the green circle in the same location as on above image.


Above image shows that there still is some solid ice present to the right of the green circle. This ice may not be able to survive such high temperatures for long. Furthermore, above image shows what looks like smoke plumes from wildfires to the left of the green circle, another sign of the high temperatures in the area and another feedback that will accelerate decline of the snow and ice cover.

Disappearance of sea ice thicker than 4 meters is now taking place north of Canada and Greenland. It looks set to virtually disappear soon, as shown by the 30-day Naval Research Laboratory animation below, ending with a forecast up to August 10, 2015.


In my experience, sea ice thickness hasn’t looked this bad for this time of the year since records began, especially when taking the loss of multi-year ice into account. Until now, the thicker multi-year sea ice used to survive the melting season, giving the sea ice strength for the next year, by acting as a buffer to absorb heat that would otherwise melt away the thinner ice. Without multi-year sea ice, the Arctic will be in a bad shape in coming years. Absence of thick sea ice makes it more prone to collapse, and this raises the question whether a collapse could occur not merely some years from now, but even this year.


Above image below shows sea surface temperature anomalies in the Arctic on August 2, 2015.

Greenland’s dramatic loss of ice mass over the past few years and the subsequent meltwater may have caused the sea ice to be larger than it would otherwise have been.

Nonetheless, this has not halted the overall decline of the sea ice. As the image on the right shows, sea ice area now is about as low for the time of the year as it was for the three lowest years on record. Furthermore, thick sea ice is shattered if not gone altogether in many places. Meanwhile, ocean heat is at a record high and there’s an El Nino that’s still gaining strength.

In conclusion, Arctic sea ice looks set to take a further battering over the next few weeks and could end up at a record low around half September 2015. If things get really bad, sea ice collapse could occur and the remaining pieces of sea ice could be driven out of the Arctic Ocean altogether by storms, resulting in a blue ocean event as early as September this year.

The situation is dire and calls for comprehensive and effective action, as discussed at the Climate Plan.


Arctic sea ice area on July 31, 2015.
Posted by Sam Carana on Sunday, August 2, 2015
Read more ...

Sunday, 19 July 2015

Arctic Sea Ice Collapse Threatens - Update 1

The image below compares the Arctic sea ice thickness (in m) on July 15, for the years from 2012 (left panel) to 2015 (right panel), using Naval Research Laboratory images.

Click on image to enlarge
The image below compares the Arctic sea ice concentration (in %) on July 18, for the years from 2012 (left panel) to 2015 (right panel), using Naval Research Laboratory images.


Above images show the dramatic decline of the sea ice in 2015, both in thickness and in concentration.

In terms of thickness, sea ice has been reduced by more than one meter in many places, such as north of Greenland and the Canadian Archipelago, all in the time span of just one month.

The dramatic fall in sea ice concentration also becomes apparent when comparing recent sea ice concentration (July 18, 2015, above right) with sea ice concentration back in May 2015 (image right, May 1, 2015).

This dramatic decline of the sea ice in 2015 is the result of a combination of factors, including:

  1. High levels of greenhouse gases over the Arctic Ocean, as illustrated by the image below, showing that on July 17, 2015 (pm), levels as high as 2512 parts per billion were recorded at 6,041 m (19,820 ft) altitude, while mean methane levels were 1830 parts per billion at this altitude.
  2. High levels of ocean heat, as illustrated by the image below showing high sea surface temperatures off the east coast of North America; much of this ocean heat will be carried by the Gulf Stream into the Arctic Ocean over the next few months.
  3. High air temperatures over North America and Siberia extending over the Arctic Ocean, as illustrated by the image below showing a temperature of 23.1°C (73.7°F), recorded on July 19, 2015, at Banks Island, in the Canadian Archipelago (green circle).
  4. Wildfires triggered by these heatwaves resulting in darkening compounds settling on snow and ice, as illustrated by the image below showing smoke covering a wide area on July 19, 2015, from the east Siberia over North America to the southern tip of Greenland.
  5. Very warm river water running into the Arctic Ocean, as illustrated by the image below, showing sea surface temperatures as high as 19°C (66.2°F) off the coast of Alaska on July 12-15, 2015.
The image below shows the already very high sea surface temperature anomalies as at July 18, 2015.

The Climate Reanalyzer image below shows the high sea surface temperature anomalies in the Pacific Ocean, and where water enter the Arctic Ocean through the Bering Strait, on July 19, 2015.


With still two months of melting to go before the sea ice can be expected to reach its minimum for 2015, the threat of sea ice collapse is ominous. The Arctic-News Blog has been warning for years about the growing chance of a collapse of the sea ice, in which case huge amounts of sunlight that previously were reflected back into space, as well as heat that previously went into melting the ice, will then instead have to be absorbed by the water, resulting in a dramatic rise of sea surface temperatures.

More open water will then come with an increased chance of storms that can cause high sea surface temperatures to be mixed down all the way to seafloor of the Arctic Ocean, which in many cases is less than 50 m (164 ft) deep. This is the case for the East Siberian Arctic Shelf, where experts estimate that huge amounts of methane are contained in subsea sediments. Already now, sea surface temperatures as high as 10°C (~50°F) are recorded there, as illustrated by the image below.


Massive amounts of ocean heat will be carried by the Gulf Stream into the Arctic Ocean over the next few months. The combined result of high sea surface temperatures being mixed down to the seafloor and the ocean heat entering the Arctic Ocean from the Atlantic and Pacific Oceans can be expected to result in dramatic methane eruptions from the Arctic Ocean seafloor by October 2015.

The situation is dire and calls for comprehensive and effective action, as discussed at the Climate Plan.


Arctic sea ice thickness on July 15, compared over the years 2012 through to 2015. Already virtually all the thick sea…

Posted by Sam Carana on Thursday, July 16, 2015
Read more ...

Friday, 28 June 2013

The Threat of Wildfires in the North

NASA/NOAA image based on Suomi NPP satellite data from April 2012 to April 2013, with grid added
A new map has been issued by NOAA/NASA. The map shows that most vegetation grows in two bands, i.e. the Tropical Band (between latitudes 15°N and 15°S) and the Northern Band in between 45°N and 75°N, i.e. in North America, Europe and Siberia. On above image, the map is roughly overlayed with a grid to indicate latitude and longitude co-ordinates.


Vegetation in the Northern Band extends beyond the Arctic Circle (latitude 66° 33′ 44″ or 66.5622°, in blue on above image from Arcticsystem.no) into the Arctic, covering sparsely-populated areas such in Siberia, Alaska and the northern parts of Canada and Scandinavia. Further into the Arctic, there are huge areas with bush and shrubland that have taken thousands of years to develop, and once burnt, it can take a long time for vegetation to return, due to the short growing season and harsh conditions in the Arctic.


Above map with soil carbon content further shows that the top 100 cm of soil in the northern circumpolar region furthermore contains huge amounts of carbon.

May 16 2013 Drought 90 days Arctic
Global warming increases the risk of wildfires. This is especially applicable to the Arctic, where temperatures have been rising faster than anywhere else on Earth. Anomalies can be very high in specific cases, as illustrated by the temperature map below. High temperatures and drought combine to increase the threat of wildfires (see above image showing drought severity).

June 25, 2013 from Wunderground.com - Moscow broke its more than 100-year-old record for the hottest June 27
Zyryanka, Siberia, recently recorded a high of 37.4°C (99.3°F), against normal high temperatures of 20°C to 21°C for this time of year. Heat wave conditions were also recorded in Alaska recently, with temperatures as high as 96°F (36°C).

On June 19, 2013, NASA captured this image of smoke from wildfires burning in western Alaska. The smoke was moving west over Norton Sound. (The center of the image is roughly 163° West and 62° North.) Red outlines indicate hot spots with unusually warm surface temperatures associated with fire. NASA image by Jeff Schmaltz, LANCE/EOSDIS Rapid Response. Caption by Adam Voiland. - also see this post with NASA satellite image of Alaska.
Siberian wildfires June 21, from RobertScribbler 
from methanetracker.org

Wildfires raged in Russia in 2010. Flames ravaged 1.25 million hectares (4,826 mi²) of land including 2,092 hectares of peat moor.

Damage from the fires is estimated to be $15 billion, in a report in the Guardian.

Cost of fire-fighting efforts and agricultural losses alone are estimated at over $2bn, reports Munich Re, adding that Moscow’s inhabitants suffered under a dense cloud of smoke which enveloped the city. In addition to toxic gases, it also contained considerable amounts of particulate matter. Mortality increased significantly: the number of deaths in July and August was 56,000 higher than in the same months in 2009. 


[From: Abrupt Local Warming, May 16, 2012]

Wildfires in the North threaten to cause large emissions of greenhouse gases and soot, which can settle on snow and ice in the Arctic and the Himalayan Plateau, with the resulting albedo changes causing a lot more sunlight to be absorbed, instead of reflected as was the case earlier. This in turn adds to the problem. Additionally, rising temperatures in the Arctic threaten to cause release of huge amounts of methane from sediments below the Arctic Ocean. This situation threatens to escalate into runway global warming in a matter of years, as illustrated by the image below.

How much will temperatures rise?
In conclusion, the risk is unacceptable and calls for a comprehensive and effective action plan that executes multiple lines of action in parallel, such as the 3-part Climate Action Plan below. Part 1 calls for a sustainable economy, i.e. dramatic reductions of pollutants on land, in oceans and in the atmosphere. Part 2 calls for heat management. Part 3 calls for methane management and further measures.


The Climate Action Plan set out in above diagram can be initiated immediately in any country, without the need for an international agreement to be reached first. This can avoid delays associated with complicated negotiations and on-going verification of implementation and progress in other nations.

In nations with both federal and state governments, such as the United States of America, the Climate Action Plan could be implemented as follows:
  • The President directs federal departments and agencies to reduce their emissions for each type of pollutant annually by a set percentage, say, CO2 and CH4 by 10%, and HFCs, N2O and soot by higher percentages.
  • The President demands states to each make the same cuts. 
  • The President directs the federal Environmental Protection Agency (EPA) to monitor implementation of states and to act step in where a state looks set to fail to miss one or more targets, by imposing (federal) fees on applicable polluting products sold in the respective state, with revenues used for federal benefits.
Such federal benefits could include building interstate High-Speed Rail tracks, adaptation and conservation measures, management of national parks, R&D into batteries, ways to vegetate deserts and other land use measurements, all at the discretion of the EPA. The fees can be roughly calculated as the average of fees that other states impose in successful efforts to meet their targets.

This way, the decision how to reduce targets is largely delegated to state level, while states can similarly delegate decisions to local communities. While feebates, preferably implemented locally, are recommended as the most effective way to reach targets, each state and even each local community can largely decide how to implement things, provided that each of the targets are reached.

Similar targets could be adopted elsewhere in the world, and each nation could similarly delegate responsibilities to local communities. Additionally, it makes sense to agree internationally to impose extra fees on international commercial aviation, with revenues used to develop ways to cool the Arctic.

- Climate Plan
Read more ...
Designed By Published.. Blogger Templates