Breaking News
Showing posts with label Beaufort Sea. Show all posts

Saturday, 21 May 2016

Arctic Climate Records Melting

An intensely warm winter and spring are melting climate records across Alaska, reports NOAA in the post ’Arctic set for record-breaking melt’. The January-April 2016 period was 11.4°F (6.4°C) warmer than the 20th century average, reports NOAA. The NOAA image below further illustrates the situation.

The sea ice is melting rapidly. Warm water from the Mackenzie River contributes to dramatic melting in the Beaufort Sea, as illustrated by the image below, showing that on May 20, 2016, the Arctic Ocean was 5°F (2.8°C) warmer than in 1981-2011 at the delta of the Mackenzie River.


The image below shows that on May 20, 2016, sea ice extent was 10.99 million square km, compared to the 12.05 million square km extent of the sea ice in May 20, 2012, as measured by JAXA. 


Sea ice reached a record minimum extent of 3.18 million square km on September 15, 2012, and chances are that the sea ice will be largely gone by September 2016.

The year 2016 is an El Niño year and insolation during the coming months of June and July is higher in the Arctic than anywhere else on Earth. Higher temperatures come with increased danger of wildfires. Greenhouse gases are at record high levels: in April and may, CO2 was about 408 ppm, with hourly peaks as high as 411 ppm (on May 11, 2016). Methane levels are high and rising, especially over the Arctic. Smoke and methane are speeding up sea ice melting, as illustrated by the image below showing smoke from wildfires in Canada extending over the Beaufort Sea (main image), in addition to high methane levels that are present over the Beaufort Sea (inset). 


Ocean heat is also very high and rising. Oceans on the Northern Hemisphere were 0.93°C (or 1.7°F) warmer in the most recent 12-months period (May 2015 through April 2016) than the 20th century average.

The image below shows sea ice extent as measured by the NSIDC, confirming that melting of the sea ice in 2016 is way ahead on previous years.


Here’s an animation comparing sea surface temperatures of the North Atlantic between May 25, 2015, and May 25, 2016.


Arctic sea ice extent was 10.7 million km2 on May 25, 2016, 1.1 million km2 less than it was on May 25, 2012, as the update below shows.


The situation is dire and calls for comprehensive and effective action, as described in the Climate Plan.


Read more ...

Friday, 13 May 2016

Arctic Sea Ice gone by September 2016?


Arctic sea ice extent is very low, much lower than it was in other years at this time of year. On May 11, 2016, Arctic sea ice extent was 12.328 million square km, according to the National Snow and Ice Data Center (NSIDC), while JAXA’s figure for extent on May 11, 2016, was only 11.57 million square km.

[ based in image from JAXA ]
JAXA figures show that Arctic sea ice extent on May 9, 2016, was 11.68 million square km, more than 18 days ahead on 2012 and 1.1 million square km smaller than it was on May 9, 2012.

The image on the right compares the Beaufort Sea and the northern part of Alaska between May 9, 2012 and May 9, 2016. As the image illustrates, there now is a lot less ice and snow cover than there was on 2012.

The situation looks set to deteriorate further over the coming months. The image below shows temperature forecast to reach anomalies as high as 5.19°C or 9.34°F for the Arctic as a whole (forecast for May 19, 2016, 0300 UTC), with temperature anomalies at the top end of the scale forecast for Alaska and eastern Siberia.


These temperature anomalies go hand in hand with a very wavy jet stream, as illustrated by the image on the right, showing loops extending all the way over the Arctic Ocean (in particular over the Beaufort Sea), taking along warm air in their path.

At the same time, the jet stream can extend far south at other places, making that cold air is moving south, out of the Arctic.

The result is a rapidly warming Arctic, which in turn makes the jet stream even more wavier, as one out of numerous feedbacks that are all  hitting the Arctic at the same time.

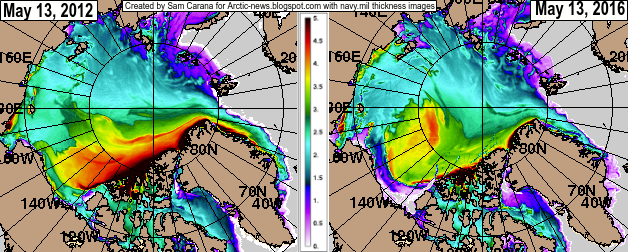
The image below compares sea ice thickness between May 13, 2012, and May 13, 2016.


The image on the right shows that sea surface temperatures near Svalbard were as high as 55°F (12.8°C) on May 11, 2016, an anomaly of 21.2°F (11.8°C) from 1981-2011. In other words, the temperature of the sea surface was 1°C in that spot from 1981 to 2011, and now this spot is 11.8°C warmer.

The image below compares sea surface temperature anomalies from 1961-1990 between May 12, 2015, and May 12, 2016.

Sea surface temperatures in the Arctic Ocean are higher than they used to be, in particular in the Bering Strait, the Beaufort Sea, in Baffin Bay and the Kara Sea.

[ click on images to enlarge ]
In summary, Arctic sea ice is in a very bad shape, while ocean heat is very high and rising. Greenhouse gas levels are at record high levels, as discussed in an earlier post and as further illustrated by the image below.

The image below shows that, over the past 365 days, warming over the Arctic have been much stronger than over the rest of the world. Air temperature anomalies of more than 2.5°C (4.5°F) show up over most of the Arctic Ocean. Furthermore, as discussed above, high temperatures are forecast to hit the Arctic over the next week.


From November 2015 to April 2016, global temperatures over land and oceans were 1.48°C (or 2.664°F) higher than in 1890-1910 (left map of the image below). On land, it was 1.99°C (or 3.582°F) warmer (right map of the image below).
[ also see comments ]
Since some 0.3°C (0.54°F) greenhouse warming had already taken place by the year 1900, warming was well above the 1.5°C (or 2.7°F) guardrail the Paris Agreement had pledged wouldn’t be crossed.

Given the above, chances are that the sea ice will be largely gone by September 2016.

The situation is dire and calls for comprehensive and effective action, as described in the Climate Plan.

Read more ...

Tuesday, 30 June 2015

Dramatic Sea Ice Decline In Beaufort Sea in June 2015

The image below illustrates the dramatic fall in sea ice thickness (in m) in the Beaufort Sea over the past month. The left panel shows sea ice thickness on May 29, 2015, and the panel on the right shows sea ice thickness on June 29, 2015.


The 30-day animation below further illustrates this dramatic fall in sea ice thickness (from June 8-29, with forecast up to July 7, 2015).


Another perspective is sea ice concentration. The image below shows the high concentration back on May 1, 2015.


The 30-day animation below shows the dramatic fall in sea ice concentration (from June 8-29, with forecast up to July 7, 2015).


Below an interview by Judy Sole with Professor Peter Wadhams, held May 15, 2015, and entitled ‘Our time is running out - The Arctic sea ice is going!’


Meanwhile, very high temperatures keep showing up within the Arctic Circle. On July 1, 2015, a temperature of 36°C (96.8°F) was reached near the Kolyma River that ends in the East Siberian Sea, as illustrated by the images below (green circle).


The image below also shows the location where this high temperature was reached (red marker), as well as the depth of the seabed and the Gakkel Ridge that runs in between the northern tip of Greenland and the Laptev Sea.


Related

- High Methane Levels over Laptev Sea
http://arctic-news.blogspot.com/2013/10/high-methane-levels-over-laptev-sea.html

- Accelerated Warming in the Arctic
http://arctic-news.blogspot.com/2015/06/accelerated-warming-in-the-arctic.html

- Gulf Stream brings ever warmer water into Arctic Ocean
http://arctic-news.blogspot.com/2015/06/gulf-stream-brings-ever-warmer-water-into-arctic-ocean.html

- High Temperatures in the Arctic
http://arctic-news.blogspot.com/2015/06/high-temperatures-in-the-arctic.html

- Heat Wave Forecast For Russia Early June 2015 
Read more ...

Tuesday, 19 August 2014

Persistently High Methane Concentrations over Beaufort Sea

High methane concentrations have been showing up over Beaufort Sea over the past few days, as shown on the image below. This follows the recent high methane concentrations over the East Siberian Sea.


The persistent character of these very high methane concentrations over the Arctic Ocean indicates that methane has started to erupt from clathrates under the seabed, triggered by very warm water reaching the bottom of the Arctic Ocean.

Methane eruptions from hydrates in sediments under the Arctic Ocean helped mean methane levels reach new records, with mean global methane readings as high as 1835 parts per billion recorded at several altitudes on August 17, 2014.


The very high sea surface temperature anomalies that show up on above image give an idea of the inflow of warm water from the Pacific Ocean through the Bering Strait. This is further highlighted by the combination image below.

[ click on image to enlarge ]
The situation is dire and calls for comprehensive and effective action, as discussed at the Climate Plan blog.


Read more ...

Sunday, 17 November 2013

More Methane as Sea Ice thins

The image below shows methane readings of 1950 ppb and higher, as at November 15, 2013, p.m., close to sea level. The image also shows sea ice concentration, as at November 7, 2013, i.e. the most recent SSMIS data available on methanetracker.

[ click on image to enlarge ]
The image shows huge amounts of methane rising from the seafloor along the fault line that crosses the Arctic Ocean. The image also shows huge amounts of methane over thinner parts of the sea ice. To illustrate this further, the November 15, 2013, Naval Research Laboratory image is added below, showing ice thickness based on the most recent sea ice data.


The image below zooms in on the large amounts of methane, stretching out all the way from the Beaufort Sea to Baffin Bay.

[ click on image to enlarge ]
Above image illustrates that methane does show up prominently where the sea ice is thin, confirming earlier conclusions that the sea ice acts as a shield, a seal if you like, holding the methane in place and thus giving microbes the time needed to decompose the methane while it is held underneath the ice.

This spells bad news, because it implies that, as the sea ice thins, more methane will be able to enter the atmosphere and contribute to warming that is already accelerating in the Arctic.

As discussed in a recent post, methane is rising from the seafloor of the Arctic Ocean due to destabilization of sediments that hold huge amounts of methane in the form of free gas and hydrates. This destabilization is in part due to warm water flowing in the Arctic Ocean along the Gulf Stream. Record warm water was present off the coast of North America in July 2013, and this warm water took some time to reach the Arctic Ocean, as shown on the image below, from that earlier post.


Water in the currents that are returning water to the Atlantic Ocean north of Canada is typically cold, as indicated by the blue color on the image below. So, while it is possible that the water was still sufficiently warm to cause methane releases from the seabed in the Beafort Sea and in Baffin Bay, in the northern parts of Canada, it seems more likely that the methane originated from areas along the fault line that crosses the Arctic Ocean and that the methane traveled - underneath the sea ice - with these currents all the way to the edges of the sea ice where the ice is sufficiently fractured and thin to allow methane to rise to the surface.

Image credit: Jack Cook, Woods Hole Oceanographic Institute
This seems confirmed by recent sea surface temperature data, as pictured below.


As above image shows, sea surface temperature anomalies (in orange, red and brown) are still showing up prominently along many parts of the Gulf Stream, all the way into the Arctic Ocean, where anomalies of more than 8 degrees Celcius have been recorded for some time now. At the same time, colder water (in green and blue) is flowing back into the Atlantic Ocean from the Arctic Ocean, along the edges of Greenland and further south. Colder currents typically flow at greater depth, but the above image also shows colder waters emerging at sea surface level, especially in areas somewhat off the coasts of Newfoundland and Nova Scotia, effectively preventing some warm water from traveling along the Gulf Stream to the Arctic Ocean.

Why are the currents that are flowing out of the Arctic Ocean into the Atlantic Ocean so strong at the moment? Powerful winds have speeded up these currents, as illustrated by the 30-days Naval Research Laboratory animation below, which also includes a 7-days forecast from November 15, 2013.


One of the feedbacks of accelerated warming in the Arctic is stronger winds and a huge amount of sea ice is currently flowing into the Atlantic Ocean, partly due to these strong winds. Similarly, the Naval Research Laboratory animation below shows huge amounts of sea ice, often very thick ice, being pushed into the Atlantic Ocean.


Last but not least, the youtube video below, Arctic Death Spiral and the Methane Time Bomb, shows some of the most powerful video footage on climate change, highlighting the danger that methane will continue to rise from the seafloor of the Arctic Ocean in ever greater quantities, resulting in a wipe-out of civilization, extinctions at massive scale and devastation of the planet as we know it.


Read more ...

Wednesday, 14 August 2013

Arctic Ocean is turning red

The Arctic Ocean is turning red, as sea surface temperatures (SST) rise. The NOAA maps below, dated August 12, 2013, show sea surface temperature anomalies across the Arctic Ocean of up to 5°C (9°F). Virtually all areas were the sea ice has disappeared are now colored scarlet red.


[ click on image to enlarge ]
The (updated) animation below shows SST anomalies from June 3 to August 26, 2013.


For a full-size animation, see http://www.ospo.noaa.gov/Products/ocean/sst/anomaly/anim_full.html

Locally, the situation can be even worse. The NOAA map below, dated August 13, 2013, shows that areas where the sea ice has disappeared in the Arctic Ocean can be exposed to sea surface temperature anomalies higher than 8°C (14.4°F).


[ click on image to enlarge ]
These anomalies are very high, even when compared to some of the recent years, when the decline of sea ice extent didn’t look as bad as it appears now.

Many people may only look at the sea ice, assuming that things are fine as long as there is no dramatic decrease in sea ice area or extent (see Cryosphere Today image right).

However, there are many other things to consider, as described in the earlier post Cyclone raging over thin ice. Most importantly, sea surface temperature anomalies this high are very alarming!

For comparison, the image below shows August sea surface temperature anomalies in 2007, 2010 and 1011.

from: http://www.arctic.noaa.gov/reportcard/ocean.html
These high sea surface temperature anomalies are firstly caused by higher sea and air temperatures as a result of global warming. Additionally, there are many feedbacks that accelerate the temperature rise in the Arctic, as discussed at the post Diagram of Doom. Local conditions can further accelerate the temperature rise in specific areas, such as where warm water from rivers flows into the Arctic Ocean.

As the map below shows, a number of large rivers end in the Kara Sea, where high temperatures have been recorded for some time.

map from: http://en.wikipedia.org/wiki/File:Rs-map.png
Another large river is the Mackenzie River, which ends in the Beaufort Sea, where sea surface temperatures of about 20°C (68°F) are currently recorded, as the image below illustrates.


Similarly, the NOAA image below shows that sea surface temperatures of up to 18°C (64.4°F) were recorded in the Bering Strait on August 12, 2013.


Note that the melting season still has quite a while to go. Arctic sea ice volume minimum is typically reached around halfway into September, which is more than one month away. On September 12-13, 2011, temperatures of 6-7°C were reached over East Siberian Arctic Shelf, and up to 9°C along the coast of Alaska.

The danger of this situation is that this dramatic rise in temperature anomalies will not remain restricted to surface waters, but that heat will penetrate the seabed which can contain huge amounts of methane in the form of hydrates and free gas in sediments.

Submarine pingoes: Indicators of shallow gas
hydrates in a pockmark at Nyegga, Norwegian Sea -
Hovland et al., Marine Geology 228 (2006) 15–23
At the moment, a cyclone is raging over the Arctic Ocean, and this causes warm surface waters to be mixed down, in many places all the way down to the seabed, due to the shallow nature of many of the seas in the Arctic Ocean.

As shown on the image right and also described at the FAQ page, there can be all kinds of fractures in the sediment, while there can also be conduits where methane has escaped earlier from hydrates, allowing heat to penetrate deep into the sediment and causing methane to escape.

Methane is kept stable inside hydrates as long as the temperature remains low. Since methane expand some 160 times in volume, compared to its compressed frozen state inside the hydrate, warming of even a small part of a hydrate can cause destabilization across the entire hydrate. It may take only a small rise in temperature of a single conduit in the sediment to set off a large abrupt release of methane, which subsequently threatens to cause further releases elsewhere in the Arctic Ocean and trigger runaway global warming, as described at the methane hydrates blog.

Read more ...

Tuesday, 25 September 2012

Expedition to study methane gas bubbling out of the Arctic seafloor

The black rectangle on this map shows the general region
where Paull and his collaborators have been studying
methane releases in the Beaufort Sea. The smaller red
rectangle indicates the edge of the continental shelf and
continental slope where they will conduct research during t
heir current expedition. These areas are shown in greater
detail in the maps below. Base image: Google Maps
Chasing gas bubbles in the Beaufort Sea

In the remote, ice-shrouded Beaufort Sea, methane (the main component of natural gas) has been bubbling out of the seafloor for thousands of years. MBARI geologist Charlie Paull and his colleagues at the Geological Survey of Canada are trying to figure out where this gas is coming from, how fast it is bubbling out of the sediments, and how it affects the shape and stability of the seafloor. Although Paull has been studying this phenomenon for a decade, his research has taken on new urgency in recent years, as the area is being eyed for oil and gas exploration.

In late September 2012, Paull and his fellow researchers will spend two weeks in the Beaufort Sea on board the Canadian Coast Guard ship Sir Wilfred Laurier, collecting seafloor sediment, mapping the seafloor using sonar, installing an instrument that will “listen” for undersea gas releases, and using a brand new undersea robot to observe seafloor features and collect gas samples.

This will be Paull’s third Beaufort Sea expedition. As in previous expeditions, he will be working closely with Scott Dallimore of Natural Resources Canada’s Geological Survey of Canada and Humfrey Melling of Fisheries and Oceans Canada’s Institute of Ocean Sciences.

Paull’s work in the Arctic started in 2003, with an investigation into the enigmatic underwater hills called “pingo-like features” (PLFs) that rise out of the continental shelf of the Beaufort Sea. (Pingos are isolated conical hills found on land in some parts of the Arctic and subarctic.)

Over time, the focus of the team’s research has moved farther offshore, into deeper water. Their second expedition in 2010 looked at diffuse gas venting along the seaward edge of the continental shelf. The 2012 expedition will focus on three large gas-venting structures on the continental slope, at depths of 290 to 790 meters (950 to 2,600 feet).

This idealized cross section of the continental shelf and
continental slope in the Beaufort Sea shows zones in the
seafloor where permafrost and methane hydrate are
likely to exist, as well as hypothetical locations of methane
seeps on the seafloor. Ocean depths not shown to scale.
Image: © 2012 MBARI
Frozen gas—a relict of previous ice ages

The Beaufort Sea, north of Canada’s Yukon and Northwest Territories, is a hostile environment by any definition of the term. It is covered with ice for much of the year. Historically, only from mid-July to October has a narrow strip of open water appeared within about 50 to 100 kilometers (30 to 60 miles) of the coast. Even at this time of year, winds often howl at 40 knots and temperatures can drop well below freezing at night. Researchers must allow extra time for contingencies such dodging pack ice and having to shovel snow off the deck of the research vessel.

Average annual air temperatures along the coast of the Beaufort Sea are well below freezing. Thus deeper soils remain permanently frozen throughout the year, forming what is called permafrost. Around the Beaufort Sea, permafrost extends more than 600 meters (about 2,000 feet) below the ground.

Permafrost also exists in the sediments underlying the continental shelf of Beaufort Sea. This permafrost is a relict of the last ice age, when sea level was as much as 120 meters lower than today. At that time, areas that are now covered with seawater were exposed to the frigid Arctic air.

As sea-level rose over the last 10,000 years, it flooded the continental shelf with seawater. Although the water in the Beaufort Sea is cold—about minus 1.5 degrees Centigrade—it is still much warmer than the air, which averages minus 15 degrees C. Thus, as the ocean rose, it is gradually warmed up the permafrost beneath the continental shelf, causing it to melt.

Quite a bit of methane, the main component of “natural gas,” is trapped within the permafrost. As the permafrost melts, it releases this methane, which may seep up through the sediments and into the overlying ocean water.

The deeper sediments of the Beaufort Sea also contain abundant layers of methane hydrate—an ice-like mixture of water and natural gas. As the seafloor has warmed, these hydrates have also begun to decompose, releasing additional methane gas into the surrounding sediment.

These maps show the area to be studied during the
current expedition. The lower map shows the continental
shelf and continental slope of the Beaufort Sea. The
upper image shows detailed seafloor bathymetry of a
portion of the continental slope that will be studied
during the current cruise, as well as the three seafloor
mounds that the researchers will explore using their
new ROV. Lower image modified from Google Maps.
Upper image: Natural Resources Canada.
A tantalizing glimpse

A 2010 expedition by Paull and his colleagues provided a tantalizing glimpse of how much methane is present on the continental shelf of the Beaufort Sea. Using a remotely operated vehicle (ROV) with video camera to explore the shelf edge, they found white mats of methane-loving bacteria almost everywhere. They also videotaped what turned out to be methane bubbles emerging from many of these mats. Based on these observations, as well as the contents of sediment cores collected by the Geological Survey of Canada, the researchers concluded that the shelf edge is an area of “widespread diffuse venting” and that “methane permeates the shelf edge sediments in this region.”

During 2010, the research team also conducted ROV dives on a shallow underwater mound called Kopanoar PLF. At the top of this mound they discovered “vigorous and continuous gas venting” that released clouds of bubbles and sediment into the water. In one ROV dive, the researchers saw something no one had ever seen before—a plume of gas bubbles that moved rapidly along the sea floor, apparently following a crack in the sediment that was in the process of being forced open by the pressure of the gas coming up from below.

The researchers also studied several deeper PLFs during the 2010 expedition. They dropped core tubes into the tops of these mounds. When the cores were lifted back onto the ship, the sediments inside fizzed and bubbled for up to an hour. The sediment was chock full of methane hydrates. Paull said, “We knew that there was a lot of gas venting going on down there, and now we have good reasons to believe that methane hydrates are present within the surface sediments. But our ROV couldn’t dive deep enough, so we weren’t able to go down and see what these areas actually looked like.” That’s one reason the team is heading back to the Arctic in 2012.

MBARI researchers tested this new mini-ROV
in the institute’s test tank before sending it out
to face the challenges of the Arctic Ocean.
Image: Todd Walsh © 2012 MBARI
Heading back for more

For the 2012 expedition, the team will continue its strategy of following the topography to study areas of gas venting in the Beaufort Sea. They plan to focus on three circular, flat-topped mounds on the continental slope. The researchers believe that these pingo-like features form at the tops of “chimneys” or conduits where methane is seeping up from sediments hundreds of meters below the seafloor.

During his previous cruises, Paull used a small ROV that could dive only about 120 meters below the surface. However, the mounds on the continental slope are in about 300 to 800 meters of water. So MBARI engineers Dale Graves and Alana Sherman designed and built an entirely new ROV just for this expedition. The new ROV is small, portable, agile, relatively inexpensive, and can dive to 1,000 meters. It can also be launched and operated by just two people (for the 2012 expedition, those two people will be Graves and Sherman).

Amazingly, the new mini-ROV went from initial design to final field tests in only 15 months. But the vehicle’s simple yet elegant design reflects Graves’ decades of experience designing ROVs and underwater control systems. “It was a fun project for me,” Graves said. “A dream come true. We designed it from scratch with a budget of just $75,000, not including labor. We mostly reused parts from MBARI’s older ROVs, and built the rest in house. MBARI’s electrical and mechanical technicians and machinists worked on it in between their other projects.”

In addition to a state-of-the-art high-definition video camera, the ROV carries a special system for collecting methane gas bubbles. This is not as easy as it sounds, because the methane gas has a tendency to turn back into solid methane hydrate, which blocks the flow of any additional methane gas into the system. The new ROV’s gas collection system includes a built-in heater to melt the hydrates and keep the gas flowing.

In addition to collecting samples of gas, the ROV will be used to look for communities of tubeworms or clams that typically grow around seafloor methane seeps. Paull said, “Nobody has ever found a living chemosynthetic biological community in the Arctic proper. But I think we have a good chance of finding them at the tops of these structures.”

Dale Graves tests the control system for MBARI’s new
mini-ROV in the lab before the Arctic expedition.
The entire system fits in just three small shipping cartons.
Image: Todd Walsh © 2012 MBARI
Addressing the big questions

Although the researchers have begun to understand where the gas in the Beaufort Sea is coming from, many other questions remain. One of the big questions the researchers are trying to answer is whether the three gas chimney structures on the continental slope are related to the gas venting systems in shallower water, on the continental shelf. As Paull put it, “Are they independent gas-venting structures that just happen to be together, or are they all part of the same system?”

Another important question is how all this methane gas affects the stability of the seafloor. When methane hydrates warm up and release methane gas, the gas takes up much more space than the solid hydrate, putting pressure on the surrounding sediments. Similarly, the decomposition of either methane hydrate or permafrost can reduce the mechanical strength of the surrounding sediment. Either process could make the seafloor more susceptible to submarine landslides.

Undersea landslides are common along the continental slope of the Beaufort Sea, but researchers do not yet know when or how they form. However, decomposing methane hydrates are believed to have triggered major landslides in other deep-sea areas. Such landslides could potentially destabilize oil platforms, pipelines, or other equipment on the seafloor, and have the potential to generate tsunamis.

If there is time during the 2012 cruise, the researchers hope to perform ROV dives on one or more underwater-landslides. In Fall 2013, when the team returns to the Beaufort Sea for a fourth time, these features will become the primary focus. During that expedition, the team also hopes to use one of MBARI's autonomous underwater vehicles (AUVs) to make very detailed maps of the shelf edge, the underwater landslides, and areas where methane is bubbling out of the seafloor.

Oil and gas companies have known for decades that deep oil and natural gas deposits exist in the sediments below the continental slope of the Beaufort Sea. With the warming of the Arctic and the retreat of sea ice, these hydrocarbons have become more accessible. However, it remains to be seen whether they can be extracted safely, economically, and without excessive environmental damage. Thus, the team’s research will not only provide new insights into previously unknown geological processes, but will also provide important information for decision-makers involved in oil and gas permitting.

For more information on this article, please contact MBARI.

Related links:

Read more ...
Designed By Published.. Blogger Templates