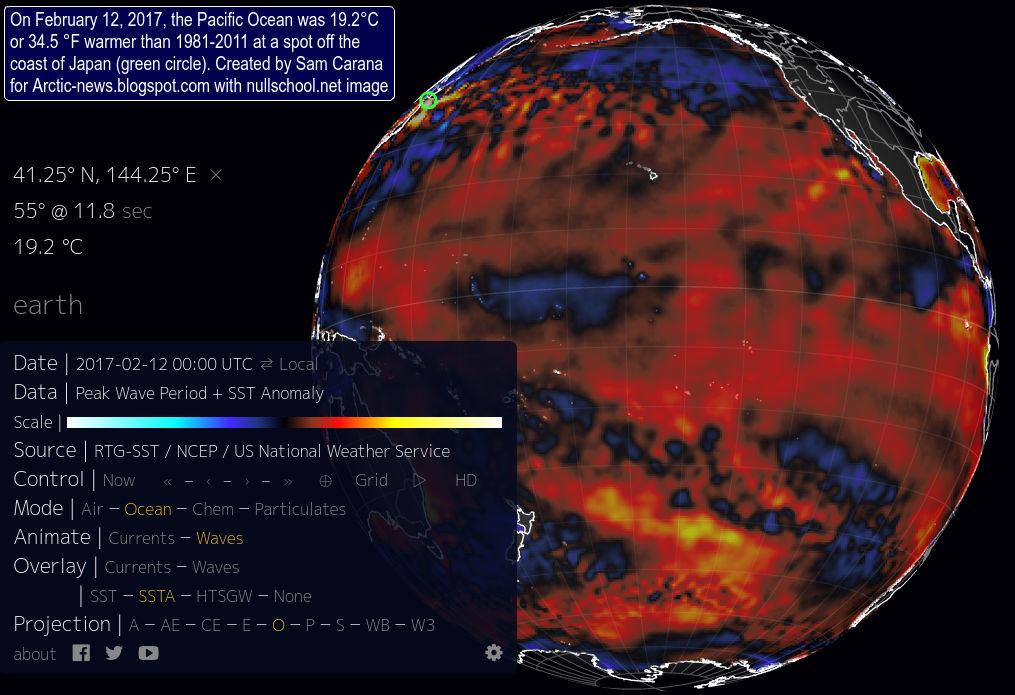
El Niño 2017 is strengthening. On March 24, temperatures in Africa were as high as 50.6°C or 123°F.

The image below shows wildfires hitting Northern China and Far East Russia on April 4, 2017. The Amur River, which forms the boundary between China and Russia, is visible on this Terra/MODIS satellite image, with red dots indicating wildfires.

Emissions associated with such wildfires can be huge, as illustrated by the image below. On April 4, 2017, sulfur dioxide (SO₂) levels were as high as 766.29 µg/m³ at a spot (marked by the green circle, left panel) north of the Amur River, in Russia, while carbon dioxide (CO₂) levels were as high as 513 parts per million at that same spot and carbon monoxide (CO) levels there were as high as 17,402 parts per billion.

These high sulfur dioxide levels indicate that sulfur that has over the past few decades been deposited there from smokestacks of coal-fired power plants, tailpipes of vehicles, etc., can re-enter the atmosphere as a result of wildfires, confirming the conclusion of earlier studies such as by Hegg et al.
This indicates that sulfur levels in the atmosphere are higher than previously estimated, given that most previous estimates were mainly based on real-time emissions from industrial activity at the time. When adding revolitalization of previously-deposited sulfur (due to wildfires) into the picture, estimates for such aerosols' masking effect of the full wrath of global warming will be higher than previously thought, and increasingly so, as wildfires are becoming painfully more common as Earth continues to warm up.
This also implies that it becomes increasingly plausible that, when aerosol levels suddenly drop during heatwaves, wet bulb temperature starts crossing sustainability limits for humans without air-conditioning. Note that in July 2016, weather conditions at a spot in the U.S. came perilously close to this limit.
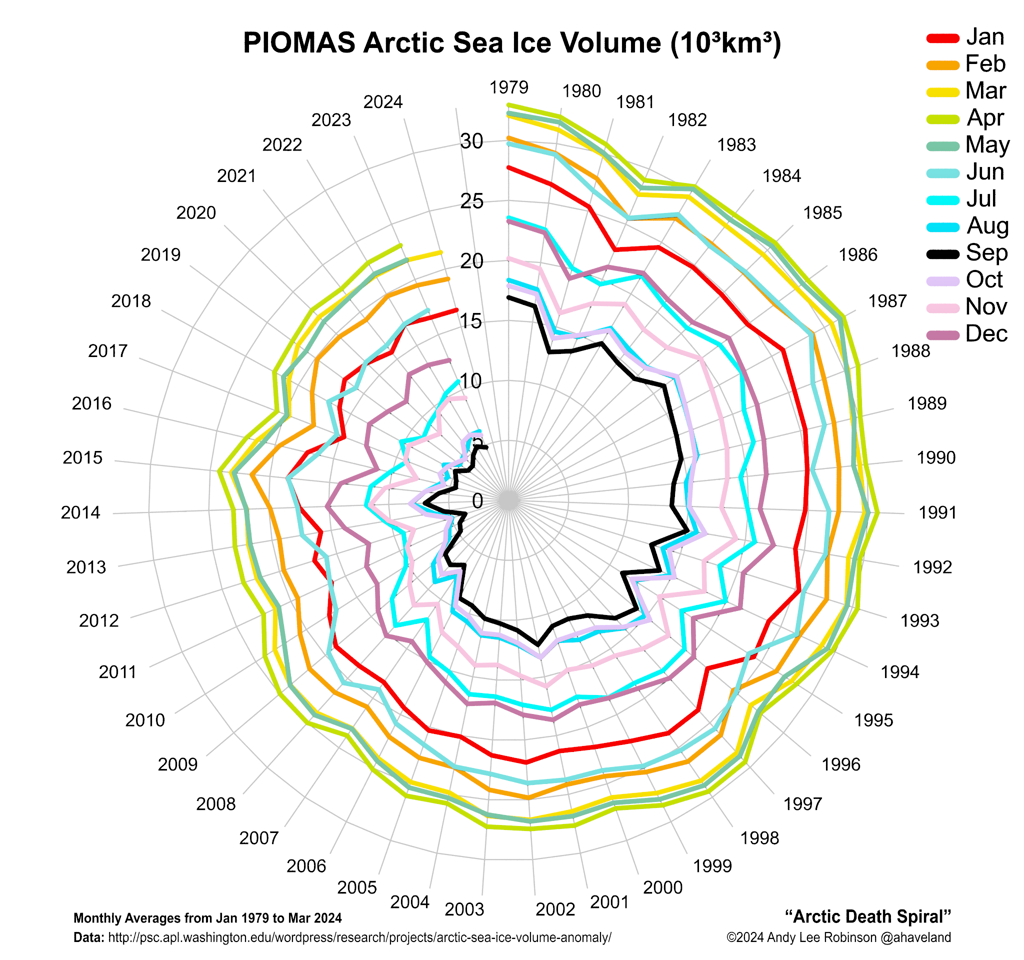
What could further contribute strongly to a rapid rise in global temperature is the combination of decline of Earth's snow and ice cover and eruptions of methane from the seafloor of the Arctic Ocean.
The Gulf Stream is heating up as the 2017 El Niño strengthens, fueled by record low global sea ice extent, which means that a lot of extra heat is getting absorbed globally (image below, by Wipneus).

Both Arctic and Antarctic sea ice extent were are record low on April 1, 2017, as the images below show.
Sea surface temperatures were as much as 5.9°C or 10.6°F warmer than 1981-2011 at the location marked by the green circle on the image below.

Over the next half year, increasingly warm waters will be carried by the Gulf Stream from the coast of North America to the Arctic Ocean. As this warmer water arrives in the Arctic Ocean, there will no longer be a large buffer of sea ice there to consume the heat, as was common for the past thousands of years and longer. Additionally, warmer water looks set to arrive in an Arctic Ocean that will be heated up like we've never seen before, as so much of the sunlight reaching the surface of the Arctic Ocean doesn't get reflected back into space anymore and as temperatures again look set to reach record highs in the Arctic during the northern summer.
Where can all this extra heat go? Sea ice will start sealing off much of the surface of the Arctic Ocean by the end of September 2017, making it hard for more heat to escape the Arctic Ocean by entering the atmosphere. The extremely dangerous situation is that it looks like much of the extra heat will instead reach sediments at the seafloor of the Arctic Ocean that contain huge amounts of methane in currently still frozen hydrates.

An image in an earlier post showed many cracks in the sea ice north of Greenland. Above image shows that huge cracks are also present in the sea ice in the Beaufort Sea.

On the combination images above and below, high concentrations of methane show up all over the Arctic Ocean, specifically over the Beaufort Sea and over and around Greenland. Note also the methane showing up over Antarctica, as discussed in an earlier post.


The image below shows wildfires hitting Northern China and Far East Russia on April 4, 2017. The Amur River, which forms the boundary between China and Russia, is visible on this Terra/MODIS satellite image, with red dots indicating wildfires.

Emissions associated with such wildfires can be huge, as illustrated by the image below. On April 4, 2017, sulfur dioxide (SO₂) levels were as high as 766.29 µg/m³ at a spot (marked by the green circle, left panel) north of the Amur River, in Russia, while carbon dioxide (CO₂) levels were as high as 513 parts per million at that same spot and carbon monoxide (CO) levels there were as high as 17,402 parts per billion.

These high sulfur dioxide levels indicate that sulfur that has over the past few decades been deposited there from smokestacks of coal-fired power plants, tailpipes of vehicles, etc., can re-enter the atmosphere as a result of wildfires, confirming the conclusion of earlier studies such as by Hegg et al.
This indicates that sulfur levels in the atmosphere are higher than previously estimated, given that most previous estimates were mainly based on real-time emissions from industrial activity at the time. When adding revolitalization of previously-deposited sulfur (due to wildfires) into the picture, estimates for such aerosols' masking effect of the full wrath of global warming will be higher than previously thought, and increasingly so, as wildfires are becoming painfully more common as Earth continues to warm up.
This also implies that it becomes increasingly plausible that, when aerosol levels suddenly drop during heatwaves, wet bulb temperature starts crossing sustainability limits for humans without air-conditioning. Note that in July 2016, weather conditions at a spot in the U.S. came perilously close to this limit.
What could further contribute strongly to a rapid rise in global temperature is the combination of decline of Earth's snow and ice cover and eruptions of methane from the seafloor of the Arctic Ocean.
The Gulf Stream is heating up as the 2017 El Niño strengthens, fueled by record low global sea ice extent, which means that a lot of extra heat is getting absorbed globally (image below, by Wipneus).

Both Arctic and Antarctic sea ice extent were are record low on April 1, 2017, as the images below show.
 |  |

Over the next half year, increasingly warm waters will be carried by the Gulf Stream from the coast of North America to the Arctic Ocean. As this warmer water arrives in the Arctic Ocean, there will no longer be a large buffer of sea ice there to consume the heat, as was common for the past thousands of years and longer. Additionally, warmer water looks set to arrive in an Arctic Ocean that will be heated up like we've never seen before, as so much of the sunlight reaching the surface of the Arctic Ocean doesn't get reflected back into space anymore and as temperatures again look set to reach record highs in the Arctic during the northern summer.
Where can all this extra heat go? Sea ice will start sealing off much of the surface of the Arctic Ocean by the end of September 2017, making it hard for more heat to escape the Arctic Ocean by entering the atmosphere. The extremely dangerous situation is that it looks like much of the extra heat will instead reach sediments at the seafloor of the Arctic Ocean that contain huge amounts of methane in currently still frozen hydrates.

An image in an earlier post showed many cracks in the sea ice north of Greenland. Above image shows that huge cracks are also present in the sea ice in the Beaufort Sea.

On the combination images above and below, high concentrations of methane show up all over the Arctic Ocean, specifically over the Beaufort Sea and over and around Greenland. Note also the methane showing up over Antarctica, as discussed in an earlier post.

Links
• Climate Plan
http://www.newsarctic.tk/p/climateplan.html
• Extinction
http://www.newsarctic.tk/p/extinction.html
• How much warming have humans caused?
http://www.newsarctic.tk/2016/05/how-much-warming-have-humans-caused.html
•Earth losing her sea ice
http://www.newsarctic.tk/2017/03/earth-losing-her-sea-ice.html
• Methane Erupting From Arctic Ocean Seafloor
http://www.newsarctic.tk/2017/03/methane-erupting-from-arctic-ocean-seafloor.html
• Nitrogen and sulfur emissions from the burning of forest products near large urban areas, Hegg et al. (1987)
http://onlinelibrary.wiley.com/doi/10.1029/JD092iD12p14701/full
• Warning of mass extinction of species, including humans, within one decade
http://www.newsarctic.tk/2017/02/warning-of-mass-extinction-of-species-including-humans-within-one-decade.html
• Low sea ice extent contributes to high methane levels at both poles
http://www.newsarctic.tk/2017/03/low-sea-ice-extent-contributes-to-high-methane-levels-at-both-poles.html
• It could be unbearably hot in many places within a few years time
http://www.newsarctic.tk/2016/07/it-could-be-unbearably-hot-in-many-places-within-a-few-years-time.html
• Climate Plan
http://www.newsarctic.tk/p/climateplan.html
• Extinction
http://www.newsarctic.tk/p/extinction.html
• How much warming have humans caused?
http://www.newsarctic.tk/2016/05/how-much-warming-have-humans-caused.html
•Earth losing her sea ice
http://www.newsarctic.tk/2017/03/earth-losing-her-sea-ice.html
• Methane Erupting From Arctic Ocean Seafloor
http://www.newsarctic.tk/2017/03/methane-erupting-from-arctic-ocean-seafloor.html
• Nitrogen and sulfur emissions from the burning of forest products near large urban areas, Hegg et al. (1987)
http://onlinelibrary.wiley.com/doi/10.1029/JD092iD12p14701/full
• Warning of mass extinction of species, including humans, within one decade
http://www.newsarctic.tk/2017/02/warning-of-mass-extinction-of-species-including-humans-within-one-decade.html
• Low sea ice extent contributes to high methane levels at both poles
http://www.newsarctic.tk/2017/03/low-sea-ice-extent-contributes-to-high-methane-levels-at-both-poles.html
• It could be unbearably hot in many places within a few years time
http://www.newsarctic.tk/2016/07/it-could-be-unbearably-hot-in-many-places-within-a-few-years-time.html