Breaking News
Showing posts with label temperature. Show all posts

Friday, 7 April 2017

Gulf Stream is heating up

El Niño 2017 is strengthening. On March 24, temperatures in Africa were as high as 50.6°C or 123°F.


The image below shows wildfires hitting Northern China and Far East Russia on April 4, 2017. The Amur River, which forms the boundary between China and Russia, is visible on this Terra/MODIS satellite image, with red dots indicating wildfires.


Emissions associated with such wildfires can be huge, as illustrated by the image below. On April 4, 2017, sulfur dioxide (SO₂) levels were as high as 766.29 µg/m³ at a spot (marked by the green circle, left panel) north of the Amur River, in Russia, while carbon dioxide (CO₂) levels were as high as 513 parts per million at that same spot and carbon monoxide (CO) levels there were as high as 17,402 parts per billion. 


These high sulfur dioxide levels indicate that sulfur that has over the past few decades been deposited there from smokestacks of coal-fired power plants, tailpipes of vehicles, etc., can re-enter the atmosphere as a result of wildfires, confirming the conclusion of earlier studies such as by Hegg et al.

This indicates that sulfur levels in the atmosphere are higher than previously estimated, given that most previous estimates were mainly based on real-time emissions from industrial activity at the time. When adding revolitalization of previously-deposited sulfur (due to wildfires) into the picture, estimates for such aerosols' masking effect of the full wrath of global warming will be higher than previously thought, and increasingly so, as wildfires are becoming painfully more common as Earth continues to warm up.

This also implies that it becomes increasingly plausible that, when aerosol levels suddenly drop during heatwaves, wet bulb temperature starts crossing sustainability limits for humans without air-conditioning. Note that in July 2016, weather conditions at a spot in the U.S. came perilously close to this limit.

What could further contribute strongly to a rapid rise in global temperature is the combination of decline of Earth's snow and ice cover and eruptions of methane from the seafloor of the Arctic Ocean.

The Gulf Stream is heating up as the 2017 El Niño strengthens, fueled by record low global sea ice extent, which means that a lot of extra heat is getting absorbed globally (image below, by Wipneus).


Both Arctic and Antarctic sea ice extent were are record low on April 1, 2017, as the images below show. 

Sea surface temperatures were as much as 5.9°C or 10.6°F warmer than 1981-2011 at the location marked by the green circle on the image below.


Over the next half year, increasingly warm waters will be carried by the Gulf Stream from the coast of North America to the Arctic Ocean. As this warmer water arrives in the Arctic Ocean, there will no longer be a large buffer of sea ice there to consume the heat, as was common for the past thousands of years and longer. Additionally, warmer water looks set to arrive in an Arctic Ocean that will be heated up like we've never seen before, as so much of the sunlight reaching the surface of the Arctic Ocean doesn't get reflected back into space anymore and as temperatures again look set to reach record highs in the Arctic during the northern summer.

Where can all this extra heat go? Sea ice will start sealing off much of the surface of the Arctic Ocean by the end of September 2017, making it hard for more heat to escape the Arctic Ocean by entering the atmosphere. The extremely dangerous situation is that it looks like much of the extra heat will instead reach sediments at the seafloor of the Arctic Ocean that contain huge amounts of methane in currently still frozen hydrates.


An image in an earlier post showed many cracks in the sea ice north of Greenland. Above image shows that huge cracks are also present in the sea ice in the Beaufort Sea.


On the combination images above and below, high concentrations of methane show up all over the Arctic Ocean, specifically over the Beaufort Sea and over and around Greenland. Note also the methane showing up over Antarctica, as discussed in an earlier post.

Links
• Climate Plan
http://www.newsarctic.tk/p/climateplan.html

• Extinction
http://www.newsarctic.tk/p/extinction.html

• How much warming have humans caused?
http://www.newsarctic.tk/2016/05/how-much-warming-have-humans-caused.html

•Earth losing her sea ice
http://www.newsarctic.tk/2017/03/earth-losing-her-sea-ice.html

• Methane Erupting From Arctic Ocean Seafloor
http://www.newsarctic.tk/2017/03/methane-erupting-from-arctic-ocean-seafloor.html

• Nitrogen and sulfur emissions from the burning of forest products near large urban areas, Hegg et al. (1987)
http://onlinelibrary.wiley.com/doi/10.1029/JD092iD12p14701/full

• Warning of mass extinction of species, including humans, within one decade
http://www.newsarctic.tk/2017/02/warning-of-mass-extinction-of-species-including-humans-within-one-decade.html

• Low sea ice extent contributes to high methane levels at both poles
http://www.newsarctic.tk/2017/03/low-sea-ice-extent-contributes-to-high-methane-levels-at-both-poles.html

• It could be unbearably hot in many places within a few years time 
http://www.newsarctic.tk/2016/07/it-could-be-unbearably-hot-in-many-places-within-a-few-years-time.html


Read more ...

Earth losing her sea ice


Earth is losing her sea ice. Arctic sea ice was at record low extent for the time of the year on March 24, 2017, as illustrated by the image below.


As the image below shows, on March 24, 2017, Arctic sea ice featured many cracks (top of Greenland is bottom left and Svalbard is on the right).


The poor state of Arctic sea ice is also reflected by the sea ice volume, as depicted by the image below, by Wipneus, showing PIOMAS anomalies up to March 2017.

On March 24, 2017, Antarctic sea ice extent was also much lower than it used to be at this time of year, as illustrated by the image below.


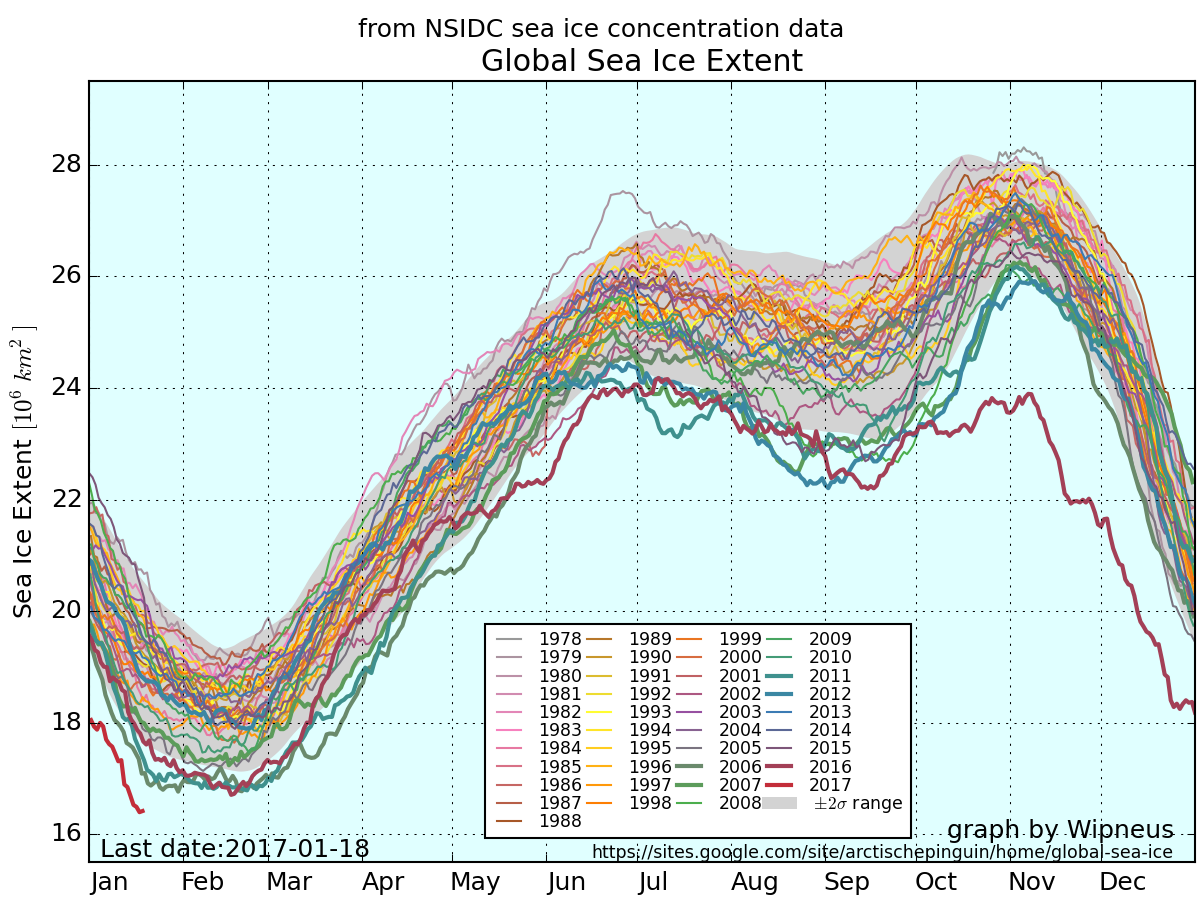
Altogether, global sea ice extent has now been at a record low for many months, as illustrated by the graph by Wipneus below. This means that a huge amount of additional sunlight has been absorbed over these months, instead of getting reflected back into space as before.


As Earth loses her sea ice, tipping point look set to be crossed that could result in rapid acceleration of Earth's temperature, as discussed at the extinction page, which warns that surface temperatures of the atmosphere could rise by some 10°C or 18°F within a decade, i.e. by 2026.

The situation is dire and calls for comprehensive and effective action, as described in the Climate Plan.


Links

• Climate Plan
http://arctic-news.blogspot.com/p/climateplan.html

• Extinction
http://arctic-news.blogspot.com/p/extinction.html

• How much warming have humans caused?
http://arctic-news.blogspot.com/2016/05/how-much-warming-have-humans-caused.html

• Warning of mass extinction of species, including humans, within one decade
http://arctic-news.blogspot.com/2017/02/warning-of-mass-extinction-of-species-including-humans-within-one-decade.html


Read more ...

Saturday, 18 March 2017

Which Trend Is Best?

NASA just released temperature data for February 2017. Should we be worried? Yes, there are many reasons to be very worried.

Let’s go back in time. This is from a post written ten years ago:
We may suddenly face a future in which many if not most people will have little or no access to food, water, medicines, electricity and shelter, while diseases go rampant and gangs and warlords loot and devastate the few livable areas left. Human beings as a species will face the risk of total extinction, particularly if many species of animals and plants that humans depend on will disappear. The post continues: Many people are still in denial about the severity of the problem of global warming, the accumulation of dangers and their progression. 

Indeed, even today many people will still deny that such events could strike suddenly, e.g. within a few years time. Many people use linear trends to predict the future many years from now. As an example, the straight blue line on the graph below is a linear trend based on NASA 1880-current meteorological stations data. The problem is that linear trends, especially when based on data that go back many years, can make people overlook important recent changes such as the temperature rise that has taken place over the past few years, the decline of glaciers and sea ice and the recent increases in concentrations of carbon dioxide in the atmosphere.

[ click on image to enlarge ]
An alternative approach is to use recent data, e.g., from the year 2012, and then calculate a polynomial trend that extends a few years into the future. Taking such an approach can result in a polynomial trend (red curved line) that is contained in the NASA Land+Ocean data from January 2012 to February 2017. This trend shows the potential for a 10°C (18°F) rise four years from now, and this should act as a powerful warning.

The appropriateness of linear versus non-linear trends was also discussed earlier at the Controversy page.

In addition to looking at trends that are contained in such data, it makes sense to analyse the different elements contributing to such a rise. Such elements are discussed in more detail at the extinction page, which confirms the potential for a 10°C temperature rise within years, i.e. by the year 2026.

The situation is dire and calls for comprehensive and effective action as described in the Climate Plan.


Links


• Climate Plan
http://arctic-news.blogspot.com/p/climateplan.html

• Ten Dangers of Global Warming
http://arctic-news.blogspot.com/p/ten-dangers-of-global-warming.html

• Extinction
http://arctic-news.blogspot.com/p/extinction.html

• Controversy
http://arctic-news.blogspot.com/p/controversy.html

• Warning of mass extinction of species, including humans, within one decade
http://arctic-news.blogspot.com/2017/02/warning-of-mass-extinction-of-species-including-humans-within-one-decade.html

Read more ...

Saturday, 4 March 2017

Low sea ice extent contributes to high methane levels at both poles

[ click on images to enlarge ]
On March 2, 2017, Antarctic sea ice extent was at a record low since satellite readings started.

As the image on the right shows, sea ice extent in 2017 (light blue) around Antarctica has been more than 1 million km² lower than the 1981-2010 median.

At the same time, Arctic sea ice extent was at a record low for the time of the year since 1979.

As the image underneath on the right shows, Arctic sea ice extent in 2017 has also been more than than 1 million km² lower than the 1981-2010 median.

[ click on images to enlarge ]
For about half a year now, global sea ice extent has been more than 2 million km² lower than it used to be, not too long ago, as illustrated by the image below, by Wipneus.

This means that a lot of sunlight that was previously reflected back into space, has been absorbed instead by Earth, contributing to global warming, especially at the poles.

Greater warming at the poles has also caused more extreme weather, resulting in stronger winds and waves and in wild weather swings, further accelerating the decline of the sea ice.

The combination of rising ocean heat and stronger winds looks set to devastate the sea ice around Antarctica. Ocean heat is increasing particularly in the top layer (see image on the right).

Warming water is increasingly reaching the coast of Antarctica. The image below illustrates how much sea ice melt has occurred close to the coast of Antarctic over the past few months, while much sea ice has drifted away from the coast due to strong currents and wind.


As said, less sea ice means that a lot of sunlight is no longer reflected back into space, but is instead further warming up the poles. As a result, methane levels can be very high at both poles. The combination image below shows methane levels as high as 2560 ppb on March 1, 2017. The image in the panel on the left shows high methane levels over Antarctica in an area with much grey, indicating that it was hard to get a good reading there. On the image in the panel on the right, high methane levels do show up clearly in that area.

[ click on images to enlarge ]
As discussed before, methane hydrates can be present both on Greenland and on Antarctica underneath thick layers of snow and ice. Due to global warming, wild weather swings are now common at the poles, as illustrated by the image below. This can cause sequences of rapid and extreme expansion, compacting and fracturing of snow and ice, resulting in destabilization of methane hydrates contained in the permafrost.


The image below shows methane levels as high as 2562 ppb, with solid magenta-colored areas showing up over the Laptev Sea on March 4, 2017.

The image below shows that sea surface temperatures in the Arctic Ocean were as high as 12.7°C or 54.9°F on March 3, 2017 (at the location marked by the green circle), i.e. 12°C or 21.6°F warmer than in 1981-2011.


Below is the same image, but in a different projection and showing sea surface temperatures, rather than anomalies. In 1981-2011, the temperature of the water at a spot near Svalbard (green circle) was 0.7°C (33.3°F.). On March 3, 2017, it was 12°C (21.6°F) warmer on that spot.


The danger is that self-reinforcing feedback loops such as albedo decline and methane releases will further accelerate warming and will, in combination with further warming elements, cause a temperature rise as high as 10°C or 18°F by the year 2026, as described at the extinction page.

The situation is dire and calls for comprehensive and effective action as described in the Climate Plan.


Links

• Climate Plan
http://arctic-news.blogspot.com/p/climateplan.html

• Extinction
http://arctic-news.blogspot.com/p/extinction.html

• Methane hydrates
http://methane-hydrates.blogspot.com/2013/04/methane-hydrates.html

• Earthquakes in the Arctic Ocean
http://arctic-news.blogspot.com/2014/04/earthquakes-in-the-arctic-ocean.html


Read more ...

Saturday, 25 February 2017

Accelerating growth in CO₂ levels in the atmosphere

CO₂ Growth

In 2016, CO₂ levels in the atmosphere grew by 3.36 ppm (parts per million), a new record since 1959 and much higher than the previous record set in 2015.


Worryingly, above graph has a trendline added pointing at a growth rate in CO₂ levels of 6 ppm per year by 2026.

Growth in levels of CO₂ in the atmosphere is accelerating, despite reports that - for the third year in a row - carbon dioxide emissions from fossil fuels and industry (including cement production) had barely grown, as illustrated by the Global Carbon Project image below.

Why is growth in CO₂ levels in the atmosphere accelerating?

So, what makes growth in CO₂ levels in the atmosphere accelerate? As discussed in a previous post, growth in CO₂ levels in the atmosphere is accelerating due to:
  • Deforestation and Soil Degradation:
    Agricultural practices such as depleting groundwater and aquifers, plowing, mono-cultures and cutting and burning of trees to raise livestock can significantly reduce the carbon content of soils, along with soil moisture and nutrients levels.
  • Climate change and extreme weather events:
    The recent jump in global temperature appears to have severely damaged soils and vegetation. Soil carbon loss and enhanced decomposition of vegetation appear to have occurred both because of the temperature rise and the resulting extreme weather events such as heatwaves, drought, dust-storms and wildfires, and storms, hail, lightning, flooding and the associated erosion, turning parts of what was once a huge land sink into sources of CO₂ emissions.
    Moreover, extreme weather events can also lead to emissions other than CO₂ emissions, such as soot, nitrous oxide, methane and carbon monoxide, which can in turn cause a rise in the levels of ground-level ozone, thus further weakening vegetation and making plants even more vulnerable to pests and infestations.
  • Oceans appear to be unable to further take up CO₂:
    Oceans appear to have turned from sinks into sources of CO₂, releasing CO₂ into the atmosphere. As discussed earlier, oceans are getting warmer, and warm water holds less oxygen than cold water. Furthermore, as the water warms, it tends to form a layer at the surface that does not mix well with cooler, nutrient-rich water below, depriving phytoplankton of some of the nutrients they need to grow. A study by Boyce et al. found a decrease of about 1% per year of phytoplankton in oceans globally. Sergei Petrovskii, co-author of a 2015 study, found that a rise in the water temperature of the world’s oceans of about 6°C could stop oxygen production by phytoplankton by disrupting the process of photosynthesis, adding that “About two-thirds of the planet’s total atmospheric oxygen is produced by ocean phytoplankton – and therefore cessation would result in the depletion of atmospheric oxygen on a global scale. This would likely result in the mass mortality of animals and humans.”
Sensitivity

Meanwhile, research including a 2014 study by Franks et al. concludes that the IPCC was too low in its estimates for the upcoming temperature rise locked in for current CO₂ levels. A study by Friedrich et al. updates IPCC estimates for sensitivity to CO₂ rise, concluding that temperatures could rise by as much as 7.36°C by 2100 as a result of rising CO₂ levels.

When also taking further elements than CO₂ more fully into account, we could face an even larger temperature rise, i.e. a rise of 10°C (or 18°F) by 2026 (compared to pre-industrial), as further described at the extinction page that specifies the different elements of such a rise, including a 0.5°C rise due to CO₂ emissions from 2016 to 2026. The CO₂ growth discussed in this post appears to be in line with such a rise and in line with the associated loss of carbon sinks and rising vulnerability of carbon pools.

The situation looks particularly threatening in the Arctic where many of the most vulnerable carbon pools are located, where temperatures are rising fastest and where CO₂ levels have recently risen rapidly (see image below with CO₂ readings at Barrow, Alaska).
[ click on images to enlarge ] 
Also note the recent rise in methane readings at Barrow (image below).
[ click on images to enlarge ] 
Action is needed!

The situation is dire and calls for comprehensive and effective action, as described in the Climate Plan.


Links

• Climate Plan
http://arctic-news.blogspot.com/p/climateplan.html

• Extinction
http://arctic-news.blogspot.com/p/extinction.html

• Monthly CO₂ not under 400 ppm in 2016
http://arctic-news.blogspot.com/2016/11/monthly-co-not-under-400-ppm-in-2016.html

• Oxygenating the Arctic
http://arctic-news.blogspot.com/p/oxygenating-arctic.html

• How much warming have humans caused?
http://arctic-news.blogspot.com/2016/05/how-much-warming-have-humans-caused.html

• Warning of mass extinction of species, including humans, within one decade
http://arctic-news.blogspot.com/2017/02/warning-of-mass-extinction-of-species-including-humans-within-one-decade.html

• Global phytoplankton decline over the past century, by Daniel G. Boyce, Marlon R. Lewis & Boris Worm
http://www.nature.com/nature/journal/v466/n7306/abs/nature09268.html

• Mathematical Modelling of Plankton–Oxygen Dynamics Under the Climate Change, by Yadigar Sekerci and Sergei Petrovskii
https://link.springer.com/article/10.1007%2Fs11538-015-0126-0

• Global warming disaster could suffocate life on planet Earth, research shows
http://www2.le.ac.uk/offices/press/press-releases/2015/december/global-warming-disaster-could-suffocate-life-on-planet-earth-research-shows


Read more ...

Wednesday, 8 February 2017

Warning of mass extinction of species, including humans, within one decade


[ click on images to enlarge ]
On February 10, 2017, 18:00 UTC it is forecast to be 0.1°C or 32.1°F at the North Pole, i.e. above the temperature at which water freezes. The temperature at the North Pole is forecast to be 30°C or 54°F warmer than 1979-2000, on Feb 10, 2017, 18:00 UTC, as shown on the Climate Reanalyzer image on the right.

This high temperature is expected as a result of strong winds blowing warm air from the North Atlantic into the Arctic.

The forecast below, run on February 4, 2017, shows that winds as fast as 157 km/h or 98 mph were expected to hit the North Atlantic on February 6, 2017, 06:00 UTC, producing waves as high as 16.34 m or 53.6 ft.


A later forecast shows waves as high as 17.18 m or 54.6 ft, as illustrated by the image below.


While the actual wave height and wind speed may not turn out to be as extreme as such forecasts, the images do illustrate the horrific amounts of energy contained in these storms.

Stronger storms go hand in hand with warmer oceans. The image below shows that on February 4, 2017, at a spot off the coast of Japan marked by green circle, the ocean was 19.1°C or 34.4°F warmer than 1981-2011.


As discussed in an earlier post, the decreasing difference in temperature between the Equator and the North Pole causes changes to the jet stream, in turn causing warmer air and warmer water to get pushed from the North Atlantic into the Arctic.

The image below shows that on February 9, 2017, the water at a spot near Svalbard (marked by the green circle) was 13°C or 55.3°F, i.e. 12.1°C or 21.7°F warmer than 1981-2011.

[ click on images to enlarge ]
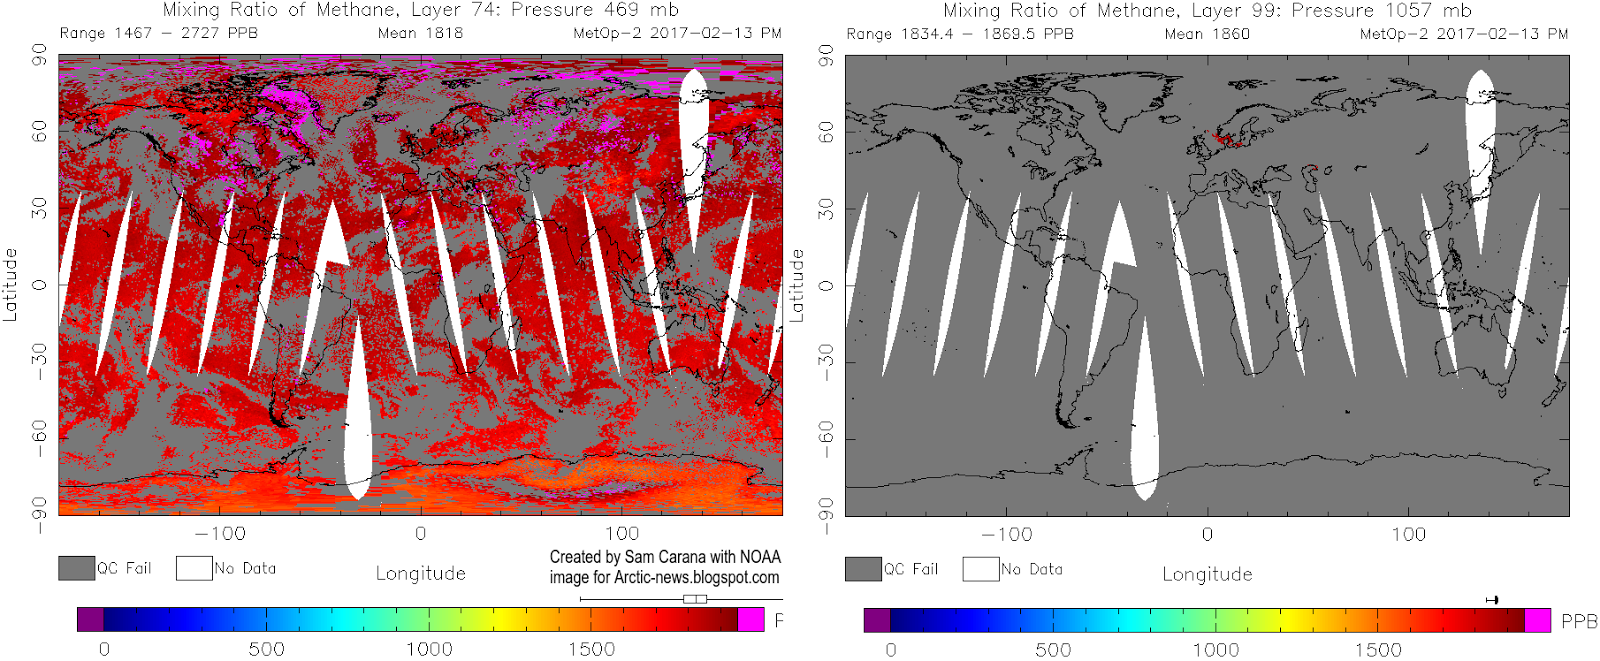
Warmer water flowing into the Arctic Ocean in turn increases the strength of feedbacks that are accelerating warming in the Arctic. One of these feedbacks is methane that is getting released from the seafloor of the Arctic Ocean. Update: The image below shows that methane levels on February 13, 2017, pm, were as high as 2727 ppb, 1½ times the global mean at the time.

[ click on image to enlarge, right image added for reference to show location of continents ] 
What caused such a high level? High methane levels (magenta color) over Baffin Bay are an indication of a lot of methane getting released north of Greenland and subsequently getting pushed along the exit current through Nares Strait (see map below). This analysis is supported by the images below, showing high methane levels north of Greenland on the morning of February the 14th (left) and the 15th (right).


The image below shows methane levels as high as 2569 ppb on February 17, 2017. This is an indication of ocean heat further destabilizing permafrost at the seafloor of the Laptev Sea, resulting in high methane concentrations where it is rising in plumes over the Laptev Sea (at 87 mb, left panel) and is spreading over a larger area (at slightly lower concentrations) at higher altitude (74 mb, right panel).


This illustrates how increased inflow of warm water from the North Atlantic into the Arctic Ocean can cause methane to erupt from the seafloor of the Arctic Ocean. Methane releases from the seafloor of the Arctic Ocean have the potential to rapidly and strongly accelerate warming in the Arctic and speed up further feedbacks, raising global temperature with catastrophic consequences in a matter of years. Altogether, these feedbacks and further warming elements could trigger a huge abrupt rise in global temperature making that extinction of many species, including humans, could be less than one decade away.


Without action, we are facing extinction at unprecedented scale. In many respects, we are already in the sixth mass extinction of Earth’s history. Up to 96% of all marine species and 70% of terrestrial vertebrate species became extinct when temperatures rose by 8°C (14°F) during the Permian-Triassic extinction, or the Great Dying, 252 million years ago.

During the Palaeocene–Eocene Thermal Maximum (PETM), which occurred 55 million years ago, global temperatures rose as rapidly as by 5°C in ~13 years, according to a study by Wright et al. A recent study by researchers led by Zebee concludes that the present anthropogenic carbon release rate is unprecedented during the past 66 million years. Back in history, the highest carbon release rates of the past 66 million years occurred during the PETM. Yet, the maximum sustained PETM carbon release rate was less than 1.1 Pg C per year, the study by Zebee et al. found. By contrast, a recent annual carbon release rate from anthropogenic sources was ~10 Pg C (2014). The study by Zebee et al. therefore concludes that future ecosystem disruptions are likely to exceed the - by comparison - relatively limited extinctions observed at the PETM.

An earlier study by researchers led by De Vos had already concluded that current extinction rates are 1,000 times higher than natural background rates of extinction and future rates are likely to be 10,000 times higher.

from the post 2016 well above 1.5°C
As above image shows, a number of warming elements adds up to a potential warming of 10°C (18°F) from pre-industrial by the year 2026, i.e. within about nine years from now, as discussed in more detail at the extinction page.


Above image shows how a 10°C (18°F) temperature rise from preindustrial could be completed within a decade.

https://sites.google.com/site/samcarana/climateplan
The situation is dire and calls for comprehensive and effective action, as discussed in the Climate Plan.


Links

• Climate Plan
http://arctic-news.blogspot.com/p/climateplan.html

• Arctic Ocean Feedbacks
http://arctic-news.blogspot.com/2017/01/arctic-ocean-feedbacks.html

• Extinction
http://arctic-news.blogspot.com/p/extinction.html

• How much warming have humans caused?
http://arctic-news.blogspot.com/2016/05/how-much-warming-have-humans-caused.html

• Estimating the normal background rate of species extinction, De Vos et al. (2015)
https://www.ncbi.nlm.nih.gov/pubmed/25159086

• Anthropogenic carbon release rate unprecedented during the past 66 million years, by Zebee et al. (2016)
http://www.nature.com/ngeo/journal/v9/n4/full/ngeo2681.html

• Evidence for a rapid release of carbon at the Paleocene-Eocene thermal maximum, Wright et al. (2013)
http://www.pnas.org/content/110/40/15908.full?sid=58b79a3f-8a05-485b-8051-481809c87076

• RT America Youtube video
https://www.youtube.com/watch?v=OSnrDRU6_2g

• RT America Facebook video
https://www.facebook.com/RTAmerica/videos/10154168391051366


Warning of mass extinction of species, including humans, within one decade. The forecast for February 10, 2017, 18:00 UTC is that it will be 32.1°F or 0.1°C on North Pole, i.e. above freezing…
Posted by Sam Carana on Wednesday, February 8, 2017
Read more ...

Friday, 20 January 2017

2016 well above 1.5°C

In December 2016, it was 6.58°C (11.84°F) warmer from latitude 83°N to the North Pole. In December 2016, the world as a whole was on average 0.82°C (1.47°F) warmer than in 1951-1980.


Temperatures are rising fast, and especially so over the Arctic Ocean. In February 2016, the world was 1.34°C (2.41°F) warmer than 1951-1980, while part of the Kara Sea was 11.3°C (20.34°F) warmer than 1951-1980, as the image on the right illustrates.

The 1951-1980 period is the default baseline used by NASA. When comparing the current temperature to years such as 1900 or 1750, the difference will be even larger, as illustrated by the image below.

In 2016, the global temperature was well above the 1.5°C (2.7°F) guardrail set by the Paris Agreement. This is illustrated by the different baselines used in image below (the use of different baselines was discussed in an earlier post), given that the Paris Agreement uses preindustrial levels as baseline.


[ click on images to enlarge ]
To some extent, the rise above 1.5°C was due to El Niño, as the trendline indicates, but the trend also indicates that temperatures will cross the 1.5°C mark in 2017 even if 2017 will be El Niño/La Niña-neutral.

Worryingly, another El Niño is actually forecast for 2017, as discussed in an earlier post.

Even more worrying is that rise of this trendline could well be too conservative.

Ocean temperatures are rising rapidly, as illustrated by the image on the right, and the rapid warming of the oceans is causing a dramatic fall in sea ice extent, as illustrated by the image below and as discussed in an earlier post.

The lack of sea ice spells trouble. Not only is snow and ice decline causing more sunlight to be absorbed (rather than getting reflected back into space as before), there are further feedbacks associated with this. As the temperature difference between the Arctic and the Equator decreases, changes are taking place to wind patterns that cause further acceleration of warming in the Arctic, as discussed in an earlier post. This in turn threatens to trigger huge amounts of methane to erupt abruptly from the seafloor.

Methane levels over the Arctic Ocean are much higher than over the rest of the world, as illustrated by the image below, showing the situation in the afternoon of January 17, 2017, with peaks reaching levels as high as 2406 ppb. Particularly worrying are the solid magenta-colored areas over the East Siberian Arctic Shelf, indicating methane levels above 1950 ppb.


When also taking into account further elements that could cause warming, a potential warming of 10°C (18°F) could eventuate by the year 2026, i.e. within about nine years from now, as discussed at the extinction page and as illustrated by the image below, from the Temperature page.


The situation is dire and calls for comprehensive and effective action, as described at the Climate Plan.


Links

• Climate Plan
http://arctic-news.blogspot.com/p/climateplan.html

• Extinction
http://arctic-news.blogspot.com/p/extinction.html

• Temperature
http://arctic-news.blogspot.com/p/temperature.html

• Accelerating Warming of the Arctic Ocean
http://arctic-news.blogspot.com/2016/12/accelerating-warming-of-the-arctic-ocean.html

• Global sea ice extent falling off chart
http://arctic-news.blogspot.com/2017/01/global-sea-ice-extent-falling-off-chart.html

• How much warming have humans caused?
http://arctic-news.blogspot.com/2016/05/how-much-warming-have-humans-caused.html


Read more ...
Designed By Published.. Blogger Templates