Arctic sea ice area on January 28, 2016, was only 12.17902 million square km. At this time of year, sea ice area hasn’t been as low as this for at least since satellite records started in 1979, as illustrated by the image below.
 |
| based on image from: arctic.atmos.uiuc.edu/cryosphere/arctic.sea.ice.interactive.html |
 |
| based on image from: nsidc.org/arcticseaicenews/charctic-interactive-sea-ice-graph |
Why is sea ice at record low?
The sea ice is in a bad shape due to very high temperatures. A forecast for January 30, 2016, shows surface temperatures over the Arctic that are 2.7°C (4.86°F) warmer than they were in 1979-2000. The image below further illustrates this, showing temperature anomalies at the top end of the scale, i.e. 20°C (36°F) above 1979-2000, in many places in the Arctic.
At this time of year, there is very little sunshine in the Arctic. Therefore, these anomalies are caused by sea water that is warmer than it used to be. The image below shows that on January 24, 2016, sea surface temperature was 12.3°C (54.2°F) at a location near Svalbard marked by the green circle, a 10.4°C (18.7°F) anomaly.
Such anomalies are in turned caused by water that is much warmer than it used to be, and that is being carried by the Gulf Stream all the way into the Arctic Ocean.
Water much warmer off the North American coast
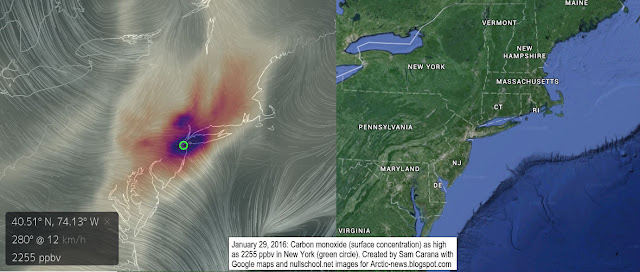
The water off the coast of North America is much warmer than it used to be due to emissions that extend from North America over the Atlantic Ocean due to the Coriolis effect. The image below, from an earlier post, shows carbon dioxide levels as high as 511 ppm over New York on November 5, 2015, and as high as 500 ppm over the water off the coast of coast of New Jersey on November 2, 2015.
 |
| from the post: 2015 warmest year on record |
Arctic sea ice in uncharted territory
Update 1: For the time of the year, Arctic sea ice is now at a record low since satellite records started in 1979, both for area and extent. The image below shows Arctic sea ice area up to February 1, 2016, when area was 12.27298 million square km.
 |
| based on image from: arctic.atmos.uiuc.edu/cryosphere/arctic.sea.ice.interactive.html |
 |
| based on image from: nsidc.org/arcticseaicenews/charctic-interactive-sea-ice-graph |
 |
| [ click on image to enlarge ] |
This situation spells bad news for what will happen later in 2016, also given the current El Niño. Less sea ice means that less sunlight is reflected back into space, resulting in more heat being absorbed by the Arctic Ocean.
As more heat reaches the bottom of the Arctic Ocean, the risk increases that heat will penetrate and destabilize sediments containing methane hydrates. Methane escaping from hydrates could strongly accelerate warming in the Arctic, causing further melting of the sea ice, in a spiral of warming that could escalate into runaway warming.
The situation is dire and calls for comprehensive and effective action, as described in the Climate Plan.
Related posts
- Why America should lead on climate
arctic-news.blogspot.com/2016/01/why-america-should-lead-on-climate.html
- Sea surface warmest on record
arctic-news.blogspot.com/2015/10/september-2015-sea-surface-warmest-on-record.html
- Climate Plan
arctic-news.blogspot.com/p/plan.html
- 2015 warmest year on record
arctic-news.blogspot.com/2015/12/2015-warmest-year-on-record.html
Arctic sea ice area on January 28, 2016, was only 12.17902 million square km. At this time of year, sea ice area hasn’t…
Posted by Sam Carana on Sunday, January 31, 2016


